- gdbserver acts as a remote agent of GDB to control processes on another machine via TCP or serial.
- To debug remotely, it's key to compile with SymbolsUse the appropriate gdb and properly configure symbol and font paths.
- gdbserver offers single-process mode and multi-process mode, also integrating with WinDbg and QEMU for kernel debugging.
- Options such as --debug, sysroot, and value size limits help diagnose problems and stabilize sessions.
If you program in C or C++ in Linux and you've never touched gdbserverYou're missing out on one of the most useful tools for debugging processes remotely, whether on a server, an embedded system, or even within a virtual machine or WSL. Far from being something "magical" or reserved for experts, gdbserver is simply a small program that communicates with gdb and controls the execution of the target process.
The key idea is very simple.: on the machine where the binary you want to debug is running (the target) you start gdbserver; on your work computer (the hostYou start gdb or even WinDbg with support for the gdb protocol. Both connect via TCP or a serial port, and from there you can set breakpoints, inspect variables, view the stack, or follow the execution step by step as if the program were running on your own machine.
What is gdbserver and when does it make sense to use it?
gdbserver is a remote debugging “agent” for GNU gdbIts function is very specific: it runs on the machine where the program to be analyzed is running, controls that process (or processes), and communicates with a gdb client located on another machine (or on the same one) through a remote connection.
In day-to-day use, gdbserver is used in two typical scenariosDebugging software that runs in embedded environments (routers, boards with stripped-down Linux, devices) IoTetc.) and debug processes on remote Linux machines, where it is not convenient or simply not possible to have a "fat" gdb with all the libraries and symbols.
On a practical level, gdbserver handles tasks such as Read and write process registers and memory, control execution (continue, pause, step through), manage breakpoints, and send all this data to gdb using the GDB remote protocol. This philosophy is very similar to that of tools like OpenOCD, which act as a bridge between gdb and a hardware external, with the difference that gdbserver runs on the same system where the binary runs.
If you come from environments Windows It's also interesting to know Debuggers like WinDbg can communicate with a gdbserver on Linux, so you can debug user processes on Linux from WinDbg using the remote debugging support via the gdb protocol that Microsoft has incorporated in recent versions.
Basic requirements for debugging with gdb and gdbserver
Before you start debugging remotely, you need to understand the host/target relationship.. The target It is the machine where the program to be debugged runs and where gdbserver will be executed; the host This is the machine from which you will run gdb (or WinDbg) and where you will have the source code and, preferably, the debugging symbols.
The essential starting point is to compile the binary with symbolsIn GCC or g++ this is achieved with the flag -gand it is usually advisable to also disable optimizations (for example with -O0This allows the debugger to more accurately display variables, macros, and code structure. For specific macros, you can use higher debugging levels, such as -g3.
On the host side you will need a compatible version of gdb with the target architecture. To debug a MIPS, ARM, or other architecture embedded system, you must use the gdb of the corresponding cross-toolchain (for example) arm-none-eabi-gdb o gdb-multiarch) and, if necessary, configure the architecture and endianness with commands , the set arch y set endian.
Regarding the connection, gdbserver supports two main typesA serial link (very common in embedded hardware, via UART) and TCP/IP, which is most convenient when the target is on the same network or is a Linux machine accessible over the network. In both cases, the command is used from gdb. target remote to connect to the endpoint exposed by gdbserver.
Ways to start gdbserver: single process and multi-process mode
gdbserver can work in two main ways When we talk about user-mode debugging: directly associated with a single process or as a "process server" that allows listing and attaching to different system processes.
In single-process mode You launch gdbserver, specifying the host:port and the program to run. In a simple example on a Linux desktop machine, you could do something like this:
Command: gdbserver localhost:3333 foo
With that command, gdbserver starts the binary. foo and he stays listening at port 3333Until a remote gdb connects, the program remains stopped; when gdb connects with target remote localhost:3333, the process begins to be controlled by the descrusher.
In multi-process mode (process server) the option is used --multiIn this case, gdbserver does not directly launch any program, but simply listens for incoming connections and allows the client (gdb or WinDbg) to manage which process to create or attach to:
Command: gdbserver --multi localhost:1234
When working with WinDbg on Linux, this multi-mode is especially interesting.Because from WinDbg itself you can list processes on the remote system, see PID, user and command line, and attach to the one you are interested in, in a similar way to how it is done with the process server dbgsrv.exe in Windows.
Remote debugging with gdbserver and gdb step by step
Let's bring this down to earth with a very typical example.: Debug a simple application on the same machine (host and target match) using gdbserver to simulate the remote scenario.
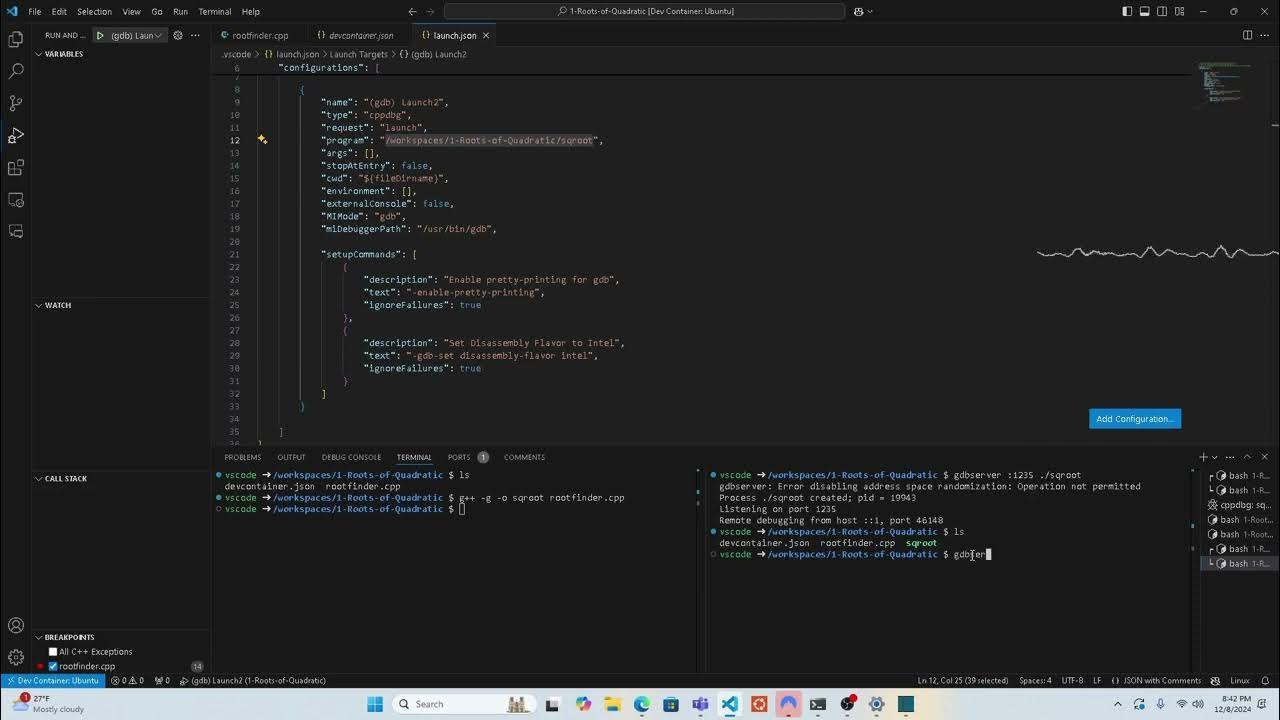
First you write and compile a small programFor example, a silly loop that prints a counter:
Command: gcc -g foo.c -o foo
The key here is the flag -gThis adds the necessary debugging information to the binary so that gdb can display lines of code, variable names, types, etc. In a "real" cross-compiling environment, you would do this compilation with the cross-toolchain and then copy both the binary and its dependencies to the target.
The next step is to start gdbserver on the targetIf host and target are the same machine, then:
Command: gdbserver localhost:3333 foo
You will see a message similar to “Process foo created; pid = XXXX; Listening on port 3333”. This indicates that gdbserver has created the process and is waiting for gdb to connect. If you are on a system where more privileges are required (for example, to attach to system processes), you may need to run the command with sudoBut it's always wise to be cautious when granting permission. root to the desulfurizer.
On the host, you start gdb specifying the local executable (the same one that is running on the target, or an identical copy with symbols):
Command: gdb foo
Once inside gdb, you establish the remote connection with:
Command: target remote localhost:3333
At that point, gdb loads the symbols from the local binary.It synchronizes with gdbserver and takes control of the process that is actually running under gdbserver. From there, the flow is the usual one: commands like break to set breaking points, continue, step, next, print to inspect variables, backtrace to see the battery, etc.
Connecting to running processes with gdbserver
You don't always want to launch the program from scratch.Often you're interested in joining a process that's already running (for example, a httpd a routera system daemon or a production service).
The typical pattern is to use the option --attach from gdbserverpassing the port where it will listen and the PID of the target process. For example, on a router where you have copied a gdbserver compiled for its architecture, you could do:
Command: gdbserver localhost:3333 --attach <pid_de_httpd>
On the host side, you will use a version of gdb that supports the router's architecture., for example gdb-multiarchconfiguring the architecture and endianness beforehand:
Command: set arch mips
set endian big
Then you specify the local file that contains the symbols. of the remote binary (for example file httpd) and, if necessary, you tell gdb where the binary is actually running on the target with set remote exec-file /usr/bin/httpdFinally, just like before, you connect with:
Command: target remote 192.168.0.1:3333
Once attachedYou can set breakpoints on specific functions (for example break checkFirmware), continue execution and let the normal flow of the program (uploading firmware from the web interface, for example) trigger the breakpoint.
Using gdbserver with WinDbg on Linux
In recent years Microsoft has added support for debugging Linux processes in WinDbg Using gdbserver as the backend. This functionality is intended for scenarios where you work in Windows but the code runs on Linux (including WSL).
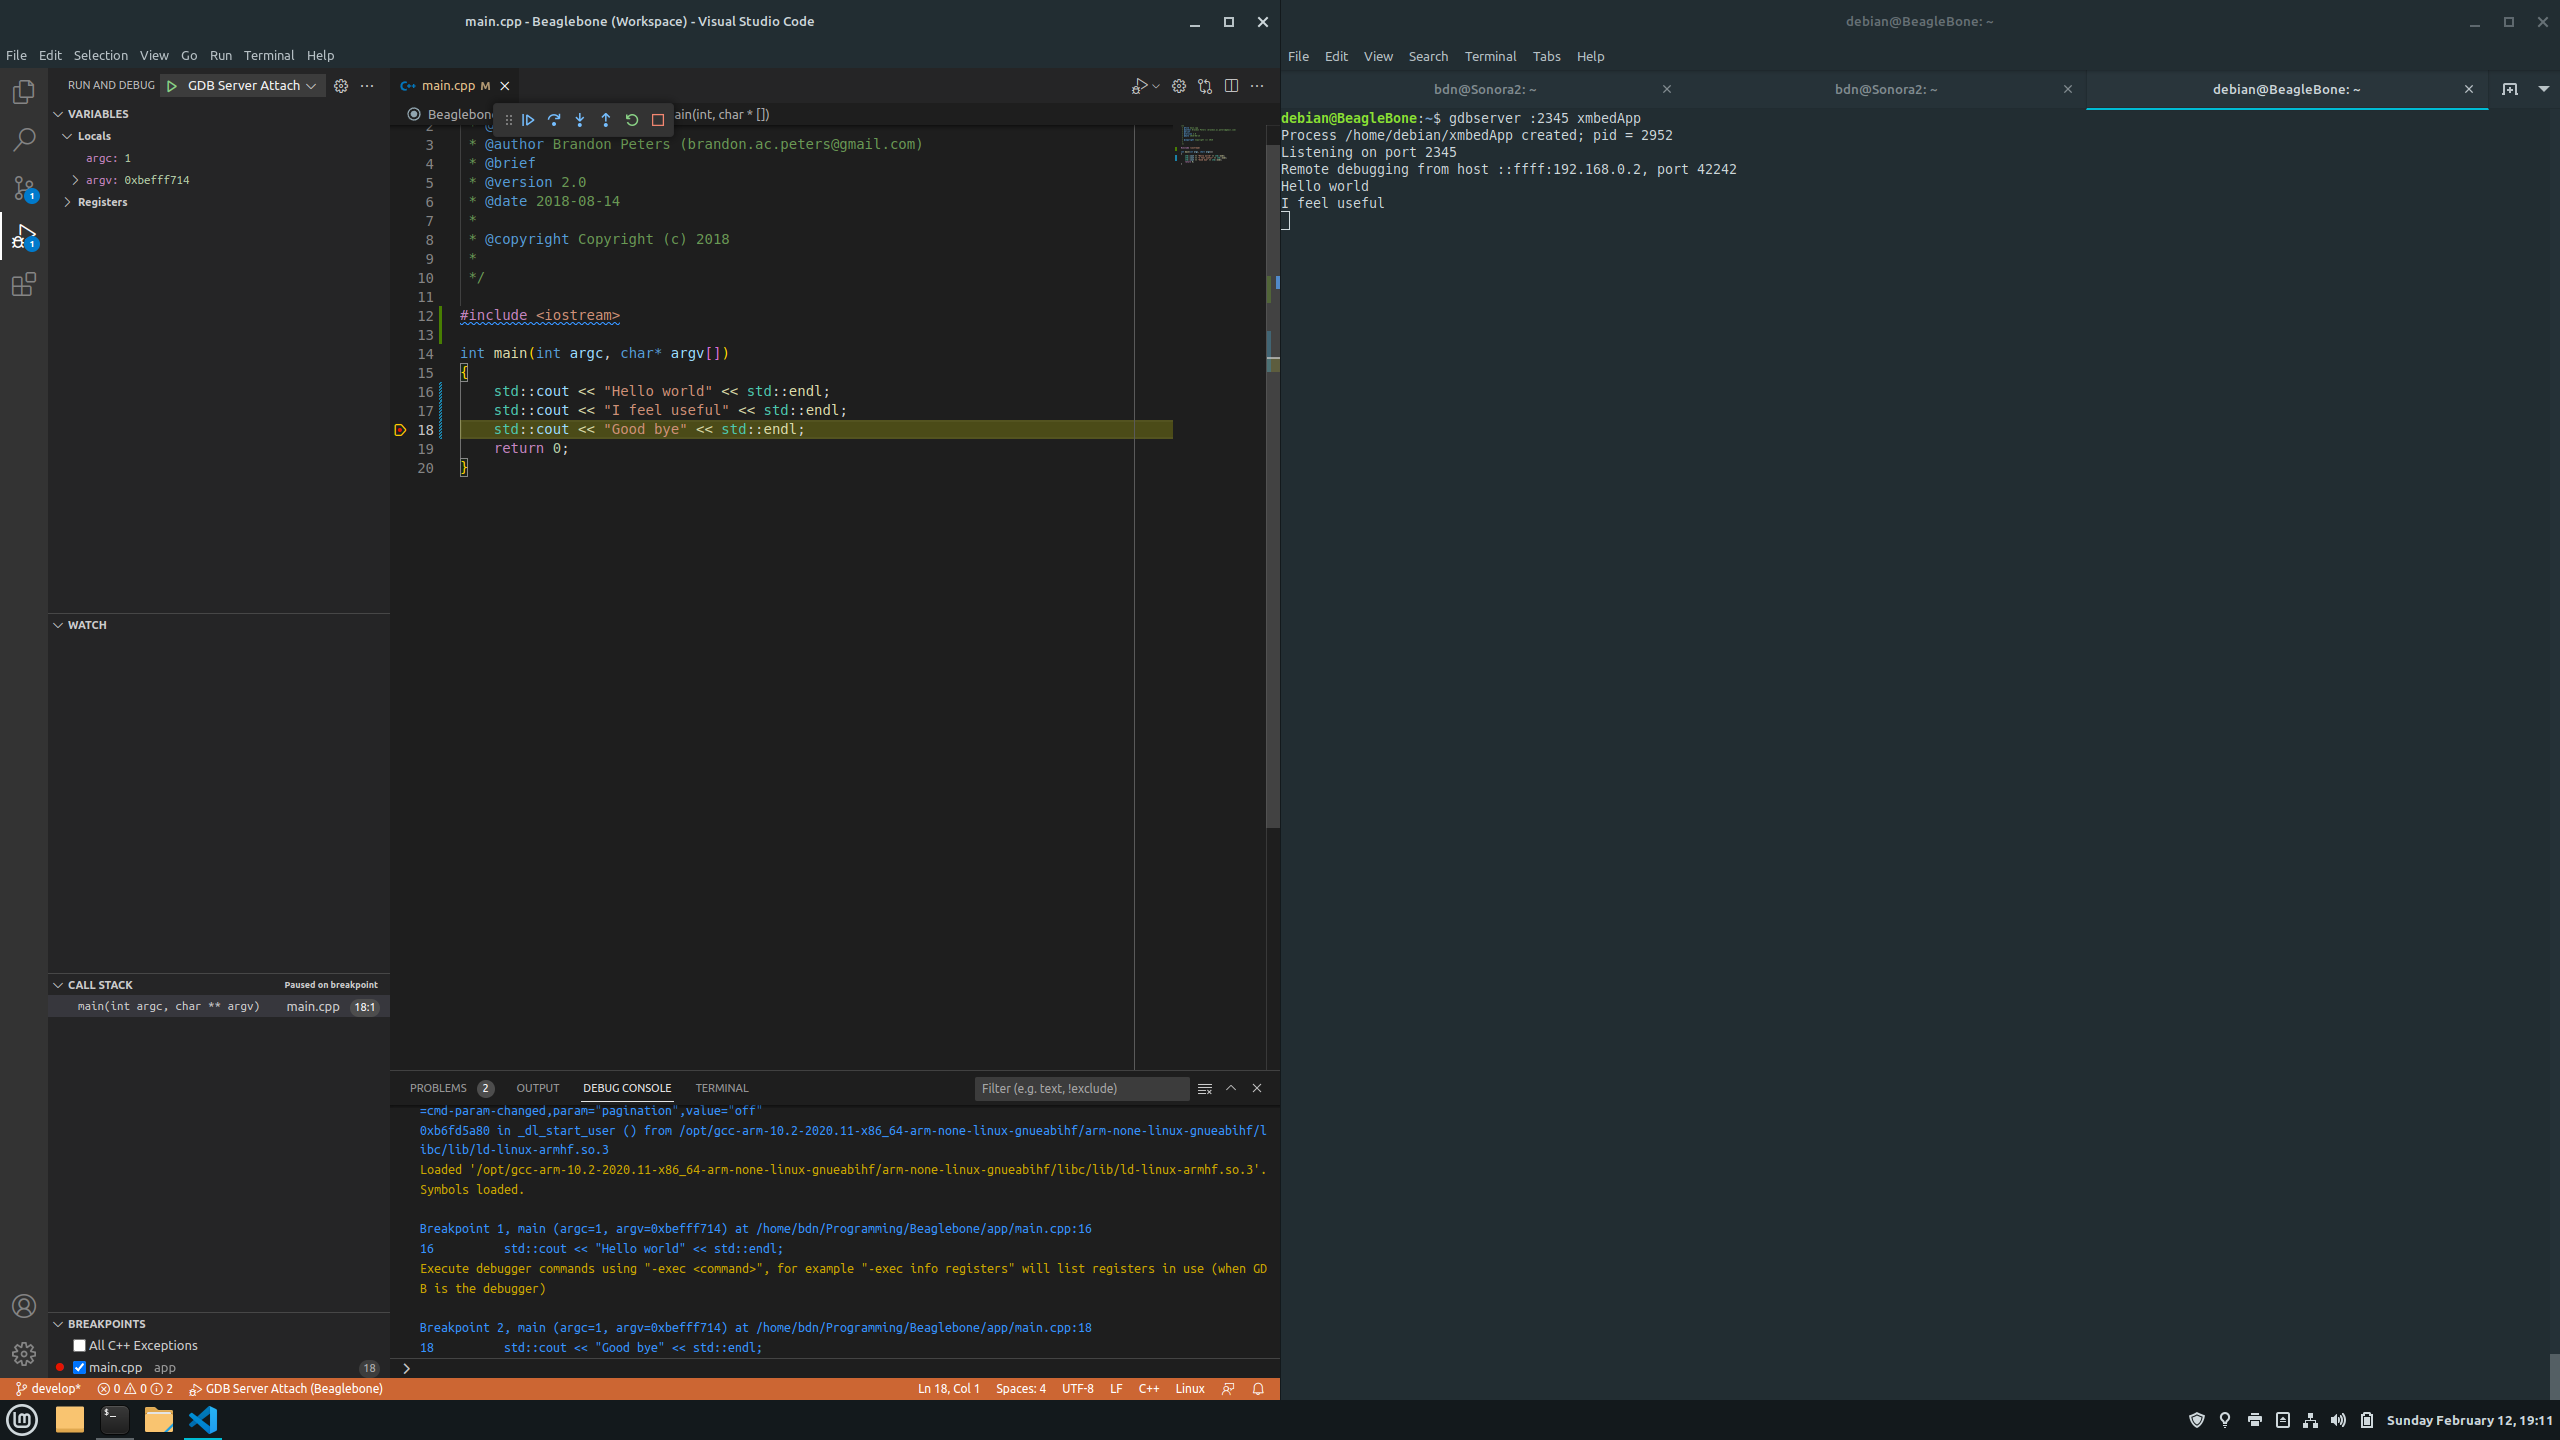
To debug a specific Linux process with WinDbg using gdbserverThe flow would be something like this: first you locate the target process on the Linux machine with a command like ps -A (for example a python3 that is running), then you launch gdbserver on the target:
Command: gdbserver localhost:1234 python3
If the environment requires it, you may need to use sudo gdbserver ...with the same security precautions as always. Once gdbserver indicates that it is “Listening on port 1234”, in WinDbg go to “File / Connect to remote debugger” and specify a connection string of the following type:
Command: gdb:server=localhost,port=1234
WinDbg uses a small gdb protocol "driver" to communicate with gdbserver and, once the connection is established, it remains stopped at the point of Boot of the process. From there you can use its stack windows, modules, memory, breakpoints, as well as commands like k to see the battery or lm to list modules (keeping in mind that some commands expect PE format and not ELF, so they may display strange data in certain cases).
gdbserver and WinDbg process server
In addition to the single-process case, WinDbg can connect to a gdbserver acting as a process server to work more similarly to how it works with remote Windows processes. In this mode, gdbserver is launched with --multi and without an associated process:
Command: sudo gdbserver --multi localhost:1234
From WinDbg, choose “File / Connect to process server” and you reuse the connection string gdb:server=localhost,port=1234When the connection is active, you can list the available Linux processes and attach to the one you want or even launch a new process.
One subtle detail must be kept in mind.WinDbg distinguishes between "process server" and "single target" depending on whether gdbserver is already attached to a process when it connects. If you left gdbserver attached to a process, closed WinDbg, and then try to reconnect, it might not be detected as a process server, and you may need to restart gdbserver.
To end a process server sessionUsually, simply pressing CTRL+D in the console where gdbserver is running and stopping debugging from WinDbg is sufficient. In some extreme cases, if there are synchronization problems, it may be necessary to completely close the debugger and restart gdbserver from scratch.
Symbol and source code management in remote debugging
One of the keys to making remote debugging convenient is having the symbols and fonts part well resolvedWithout symbols, navigating the stack or setting breakpoints on specific functions becomes torture.
In classic gdb + gdbserver scenarios, it is ideal to keep a copy of the executable with symbols on the host. (unstripped) and the source tree. gdb does not require the remote binary to contain the symbols; it is sufficient that the local file you load with file match the remote executable at the offset level.
In the world of WinDbg and Linux debugging, services like DebugInfoD have also emerged.which expose symbols and fonts over HTTP. WinDbg can use special paths of the type DebugInfoD*https://debuginfod.elfutils.org both .sympath as in .srcpath to download on-demand DWARF symbols and Linux ELF binaries source code.
In a specific example with WSL, where the user code is under C:\Users\Bob\You could tell WinDbg:
Command: .sympath C:\Users\Bob\
.srcpath C:\Users\Bob\
And if you also want to use DebugInfoD for system binaries:
Command: .sympath+ DebugInfoD*https://debuginfod.elfutils.org
.srcpath+ DebugInfoD*https://debuginfod.elfutils.org
With this configuration, when you inspect the stack or enter libc functionsWinDbg may attempt to download the corresponding DWARF symbols and, if the server also exposes the code, display the source in considerable detail, although internally the Windows toolchain does not handle ELF and DWARF as "natively" as PE and PDB.
Practical example: debugging a C++ program with gdbserver and WinDbg
An illustrative example is a small C++ application that writes a greeting to the screen., compiled in WSL with debugging symbols. Imagine a program that reserves a std::array<wchar_t, 50> and copies a longer message into it, causing the text to be truncated and characters to appear ???? in the end.
After compiling with something like:
Command: g++ DisplayGreeting.cpp -g -o DisplayGreeting
You start gdbserver against that binary:
Command: gdbserver localhost:1234 DisplayGreeting
In WinDbg you connect with the string gdb:server=localhost,port=1234 And, once the session is established and symbol and font paths are configured, you set a breakpoint in DisplayGreeting!main, you can use dx greeting to inspect the local array and see its size (50 positions), and visually check in the memory tab or in the variables view how the greeting is cut off.
The beauty of this example is that it demonstrates that, even without full support for all ELF/DWARF formats in WinDbgYou can traverse stacks, inspect types, set breakpoints by function name, and navigate through C++ code reasonably comfortably using gdbserver as a remote backend.
Debugging the Linux kernel with qemu and gdb
gdbserver is not only used in user mode; there are also very powerful scenarios in kernel mode.especially when you combine QEMU with debugging support. Although here the role of “gdbserver” is fulfilled by QEMU's own option, the approach is identical: one end runs the system to be debugged and opens a gdb port; the other end is either gdb or a debugger that speaks the remote protocol.
To debug the kernel, you need to compile it with specific debugging options.: activate the generation of debugging information (CONFIG_DEBUG_INFO), the GDB kernel scripts (CONFIG_GDB_SCRIPTS) and the kernel's own debug mode (CONFIG_DEBUG_KERNELIt is also important to disable options that remove symbols during linking, such as "Strip assembler-generated symbols during linking".
After compiling you will get a binary file vmlinux “not stripped”which is the one you'll use from gdb. You also need a basic initramfs, which you can generate with a command like:
Command: mkinitramfs -o ramdisk.img
Then you start QEMU with debugging parametersA typical example includes the option -gdb tcp::1234 to open a gdb-compatible remote endpoint, and -S so that the virtual machine starts paused from the beginning. You also specify the kernel with -kernel vmlinux, the -initrd ramdisk.img, the memory with -m 512 and you usually redirect the console to ttyS0 to manage everything from the terminal.
With QEMU detained awaiting gdbFrom the host machine, you start gdb pointing to vmlinux and you connect with target remote localhost:1234From there you can set early breakpoints, for example a hb start_kerneland control execution with commands such as c (continue) and CTRL+C to pause again.
Recent changes and nuances in gdb and gdbserver
In modern distributions like Red Hat Enterprise Linux 8, there are a number of changes in gdb and gdbserver that are worth keeping in mind.especially if you're coming from previous versions or have scripts that analyze the debugger output.
On one hand, gdbserver now starts the “lower” processes using a shellJust like gdb, this allows variable expansion and substitutions on the command line. If for any reason you need to disable this behavior, there are specific settings documented in RHEL 8 to revert to the previous mode.
Several things have also been removed or changed: debugging support for Java programs compiled with gcj, the HP-UX XDB compatibility mode, commands such as set remotebaud (replaced by set serial baud) or compatibility with a certain older format of stabsFurthermore, the thread numbering is no longer global, but by "lower" thread, and appears as inferior_num.thread_num, with new convenience variables such as $_gthread to refer to the global identifier.
Another relevant new feature is the adjustment max-value-sizeThis limits the amount of memory that gdb can allocate to display the contents of a value. The default is 64 KiB, so attempts to print huge arrays or massive structures may result in a "value too large" warning instead of displaying all the available memory.
It has also been adjusted how gdb handles the sysrootThe default value is now target:This means that for remote processes, it will first attempt to find libraries and symbols on the target system. If you want it to prioritize local symbols, you should run set sysroot with the route that interests you before doing target remote.
Regarding the command history, the environment variable now used is GDBHISTSIZE instead of HISTSIZEThis allows you to fine-tune how long you want to retain the commands you've typed in debugging sessions without interfering with the behavior of other applications that use the line reading library.
Workflow tips and troubleshooting with gdbserver
To have a comfortable workflow, there are some patterns that tend to work very well. When developing for embedded systems or remote servers, the first step is to automate symbol compilation and binary deployment to the target as much as possible. This way, you always know which version of the executable is running and have the symbol copy readily available on the host.
In environments with many crash cores, it's worth learning how to use gdb in batch mode., with flags like --batch, --ex y -x to automatically launch commands on a list of cores and process their backtraces from scripts (for example in PythonThis allows you to quickly filter out repeated problems, group failures by stack trace, etc.
When something goes wrong with the remote connection, the option --debug gdbserver is your best friendIf you start, for example, a process server with:
Command: gdbserver --debug --multi localhost:1234
The gdbserver console will show detailed traces of what is happening At the remote protocol level, this includes incoming packets, formatting errors, disconnection problems, etc. This is very useful when your gdb server suddenly disconnects, a process crashes as soon as a breakpoint is set, or your debug GUI sends something that gdbserver doesn't understand.
In contexts such as a TP-Link router where you attach gdbserver to a critical process like httpdIt's relatively common for certain breakpoints to create race conditions or watchdogs that kill the process when it remains "stuck" for too long in the debugger. In these situations, it may be necessary to adjust which signals are blocked, which threads are controlled, and, if applicable, modify the system configuration itself (timeout times, hardware watchdogs) to allow for longer debugging sessions.
Using gdbserver well involves combining several piecesCompile with appropriate symbols, choose the correct gdb for the architecture, configure symbol and source paths, understand the two main modes of gdbserver (single-process and multi-process), and don't be afraid to pull from the mode --debug when the connection doesn't behave as expected. With that foundation, debugging applications running on a remote Linux system, a router, or a virtual machine with a custom kernel from your PC becomes quite routine and, above all, incredibly useful.
Passionate writer about the world of bytes and technology in general. I love sharing my knowledge through writing, and that's what I'll do on this blog, show you all the most interesting things about gadgets, software, hardware, tech trends, and more. My goal is to help you navigate the digital world in a simple and entertaining way.