- Cinebench evaluates the CPU (and in 2024 also the GPU) using real 3D scenes based on Cinema 4D and Redshift.
- Single core and multicore scores are linear and should not be compared between different versions (R20, R23, 2024).
- A good score depends on the use: in games, single core is important, in 3D rendering, multicore and MP ratio are important.
- For reliable results, it is advisable to close programs, monitor temperatures, and always use the official Maxon version.
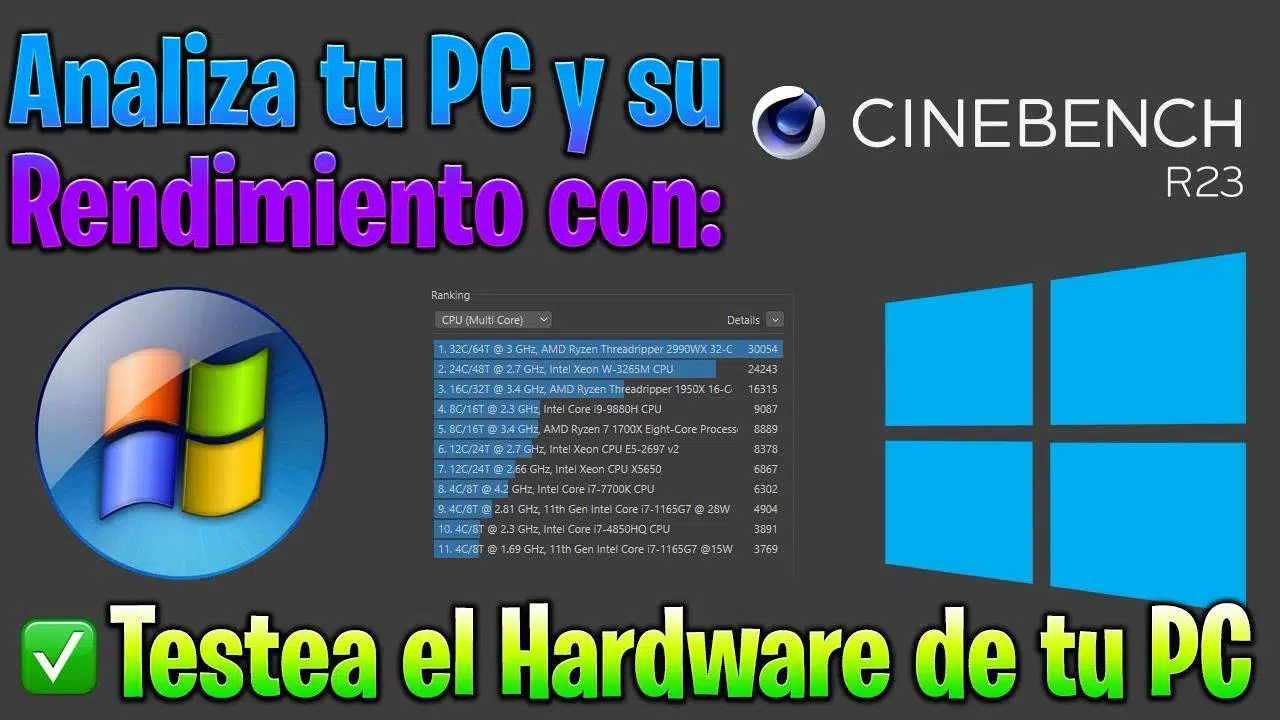
Accurately measuring CPU performance is almost mandatory these days if you work with 3D, video editing, VFX, or simply want to know if your PC is performing as it should. Among all the available tools, Cinebench R23 and Cinebench 2024 (which is equivalent to what many people now call R24) have become the benchmark for comparing processors quickly, for free, and quite reliably.
Understanding Cinebench and how to run it step by step will allow you to interpret its scores, compare your CPU with other models, and detect if something is wrong with your system (throttling, poor cooling, inadequate configuration, etc.). Let's review exactly what this application does, the differences between versions (R20, R23, and 2024), how to read the results, and what values to consider "good" depending on your computer usage.
What is Cinebench and what is it really used for?
Cinebench is a benchmarking tool created by Maxon, the same company behind the well-known 3D software Cinema 4D. Its purpose is to measure the performance of your CPU (and, in current versions, also your GPU) using very demanding 3D rendering scenes, similar to those used in professional projects. Instead of running an abstract synthetic test, Cinebench subjects the processor to a workload that closely resembles what happens when rendering animations or photorealistic images.
The technical foundation of Cinebench has always been the Cinema 4D rendering engine. In classic versions (such as R15, R20, and R23), the Cinema 4D CPU engine was used, while Cinebench 2024 has made the switch to the Redshift engine, also from Maxon, which can utilize both the CPU and GPU for rendering. This means the benchmark has adapted to the current needs of 3D production and the emergence of new processor architectures.
Cinebench 2024 is particularly interesting because it runs on different types of hardware : Intel and AMD x86/64 CPUs and modern ARM processors, such as the Apple Silicon M1, M2, and M3. This allows you to compare the performance of a workstation with a Threadripper, a laptop with an Intel Core processor, or a Mac with an M chip directly within the same type of test, on both Windows and macOS.
Over the years, Cinebench has evolved in parallel with Cinema 4D itself: the complexity and size of the test scenes have increased, scalability on CPUs with many threads has been improved, and the algorithms have been refined so that the results better reflect what happens in real-world rendering projects. Each generation (R15, R20, R23, and now 2024) has represented a leap in both rigor and precision.
Key features of Cinebench for measuring CPU

Cinebench's strength lies in measuring CPU performance in 3D rendering tasks. The benchmark launches an intensive calculation in which your processor has to complete a complex ray-traced scene. This process takes advantage of all modern instructions (such as AVX in R20 and later) and utilizes multiple threads, highlighting both the power of a single core and the overall capacity when all cores are working simultaneously.
In its CPU tests, Cinebench distinguishes between single-core and multi-core performance . The single-core test renders using a single thread, ideal for understanding how the CPU performs in tasks that don't scale well with multiple cores (interface, viewport, active work, certain parts of the video editing workflow, etc.). The multi-core test utilizes the full capacity of the processor, providing a clear picture of its raw power for rendering, encoding, and massively parallelizable workloads.
While Cinebench has traditionally focused on the CPU , the 2024 version introduces GPU evaluation using Redshift. In this mode, your graphics card's ability to render 3D scenes with demanding ray tracing algorithms is measured, pushing it virtually to its limits. This is crucial if you work with GPU-based rendering engines or if your 3D workflow relies on both the graphics card and the processor.
The great advantage of Cinebench over other benchmarks is that it simulates real-world production scenarios: it's not just an arbitrary number, but a reflection of how long your hardware takes to complete a Cinema 4D/Redshift scene. This makes it very useful for animation studios, render farms, and professionals who need to size up or justify the purchase of new workstations.
Despite its professional nature, Cinebench is very easy to use . The interface is quite simple: you choose the test (multicore CPU, single-core CPU, GPU in the 2024 version), press the start button, and wait for it to finish. You don't need in-depth technical knowledge to get a consistent score; you just need to have your system properly configured and no distracting background processes running.
How Cinebench works and how to interpret its scores
The mechanism behind Cinebench is always the same at a conceptual level : a static 3D scene is loaded, and a complete render is launched using the CPU (and optionally the GPU in 2024). Each frame or part of the image is calculated and assembled on screen, so you can see how the render progresses while the test is running. At the end, a result is generated in the form of a score.
The Cinebench score is a quantitative performance metric : the higher the number, the faster your CPU (or GPU, depending on the test) is under that type of workload. Scores are measured in Cinebench points and are linear. This means that if one CPU scores 2000 points and another 1000 in the same version, the first performs approximately twice as well as the second in that specific Cinema 4D scenario.
It's important not to mix scores between different versions . Cinebench R20, R23, and Cinebench 2024 use different scenes with varying complexity and, in some cases, different rendering engines (classic CPU versus Redshift). Therefore, an R20 result isn't directly comparable to an R23 result, much less a 2024 result. Whenever comparing scores, make sure they come from the same version.
In everyday use, the scores are interpreted as follows : the single-core score tells you about the system's agility and how it will perform in less parallelized tasks (many video games , some video editing, interactive modeling, etc.). The multi-core score tells you how long the machine will take to complete large renders, encode long videos, or simulate complex physical scenes.
Compared to other benchmarks like Geekbench or 3DMark , Cinebench is much more focused on 3D content creation and rendering. Geekbench measures a wide range of synthetic workloads, while 3DMark focuses primarily on GPUs and gaming. If your priority is knowing how your CPU will perform with Cinema 4D, CPU-based rendering, or other demanding 3D tasks, Cinebench is the de facto standard.
Practical applications of Cinebench in the real world
Cinebench is widely used in the professional and enthusiast sectors to evaluate and compare CPUs and GPUs across different platforms. Manufacturers, PC integrators, reviewers, and power users use it to generate performance benchmarks and determine which processors offer the best balance of power, price, and energy consumption.
For hardware manufacturers, Cinebench scores are crucial . The results obtained in their labs and those shared by specialized media serve as a benchmark for adjusting frequencies, TDP, turbo policies such as Precision Boost Overdrive mode , and product segmentation strategies. A good Cinebench score is often another key element in the marketing argument for a new CPU.
If your world revolves around gaming or professional graphic design , Cinebench helps you compare your CPU against others. In games, the single-core score is a quick indicator of whether you'll get good performance, while in 3D design, VFX, or motion graphics, the multi-core score tells you how well you can handle demanding scenes without excessive wait times.
It's also a very convenient tool after building or upgrading a PC . Running Cinebench R23 or Cinebench 2024 after a clean install lets you check if your processor is performing as the reviews promise. If your scores are significantly lower than expected, there may be a problem with temperature, BIOS , memory, or system configuration.
Finally, Cinebench is very useful in render farms and multi-user environments . It allows you to standardize data across machines, assign jobs to the fastest machines, plan hardware upgrades, and quickly detect if any workstation has fallen behind or is underperforming.
Technical information, limitations and system requirements
On a technical level, each version of Cinebench has its own particularities . R20 introduced support for AVX instructions, improvements to the ray tracing scene, and a much heavier workload than R15 (up to eight times more demanding in computation and four times more in memory). R23 followed this trend, refining stability in prolonged tests and better adapting to modern, multi-core CPUs.
One of the major technical improvements from R20 onward was the increase in the maximum number of supported threads, which went up to 256. This allows extremely powerful processors, such as the 64-core Threadripper and EPYC, to be tested without issue, and leaves room for future generations with even more threads.
Cinebench also has limitations you should be aware of . In R23, for example, the OpenGL GPU benchmark that existed in previous versions was removed. Maxon felt that this benchmark didn't accurately represent real-world OpenGL performance and preferred to focus on the CPU. Therefore, if you want to evaluate your graphics card in R23, you'll have to use other GPU-specific benchmarking tools.
Regarding system requirements , Cinebench needs a compatible processor (x86-64 on Intel/AMD or modern ARM in the case of version 2024), a reasonable amount of RAM (the more the better to avoid system swapping), and a compatible operating system, typically an updated version of Windows or macOS. The CPU must support the necessary instructions (such as AVX in R20 and later) to run the test scene smoothly.
It's worth remembering that Cinebench is free and easy to install . It can be downloaded directly from the official Maxon website and doesn't require complicated activation. Simply install it, run it, and you can start running tests, provided your computer meets the minimum requirements and is reasonably well configured.
Key results from Cinebench R23 and what they mean

The Cinebench R23 results table clearly shows how high-end CPUs dominate the multi-core test. Processors like the AMD Threadripper 3990X (64 cores, 2.9 GHz) achieve multi-core scores close to 75.000 points, while maintaining around 1260 points in single-core performance. The Threadripper PRO 3995WX and 5995WX follow closely behind, also scoring above 60.000 points in multi-core tests.
Among "conventional" desktop CPUs , models like the Intel Core i9-13900K (24 hybrid cores, around 3.0 GHz base clock) stand out with over 40.000 multicore points and a single-core score of around 2200 points. Also noteworthy is the AMD Ryzen 9 7950X, with 16 cores and a high base clock speed, exceeding 38.000 points in multithreaded performance and reaching around 2050 points in single-core performance.
The table clearly shows the leap in single-core performance between Intel's 12th and 13th generations. Models like the 12900KS, 13700K, and the 13900K itself achieve higher single-core scores than most Ryzen 5000 and 7000 series processors, albeit at the cost of significantly higher power consumption. This difference in energy efficiency makes the choice between Intel Core and AMD Ryzen not so straightforward.
Another striking example is the comparison between the Ryzen 9 7950X and the Threadripper 2990WX . Even though the 2990WX has twice the number of cores as the 7950X, the leap in IPC and clock speeds brought by the newer architecture allows the 7950X to easily outperform it in Cinebench R23. This demonstrates how architecture and clock speed can be just as important as the simple number of cores.
Apple Silicon chips also feature in the rankings . The Apple M1 Ultra, with 20 CPU cores, scores around 21.700 points in multicore and about 1570 points in single-core. The M1 Max and M1 Pro hover around 12.000 points in multicore, while the M2, with 8 cores, surpasses 8500 points in multithreaded performance and achieves around 1700 points in single-core, marking a clear improvement over the original M1.
Download and run Cinebench R23 step by step
To use Cinebench R23, the first step is to download it from the Maxon website . Once on your system, the installation process is very simple: next, next, finish. When you open it, you'll see the option to run the CPU test with all cores or the single-core test directly from the main interface.
The most common way to use Cinebench R23 is to let it run the multi-core test with the default settings. The program is designed to perform as many render passes as your PC can complete in 10 minutes. This fixed duration is used to account for the performance drop due to thermal throttling that can occur under sustained workloads.
If you only want to do a quick run , you can manually stop the test by clicking "Stop" when the first complete render is finished. Additionally, if you go to "File > Advanced Benchmark," you can disable the 10-minute limit by unchecking the "Minimum Test Duration" option, allowing you to get a score with a single run without waiting so long.
Maxon no longer includes a GPU benchmark in R23 . The old OpenGL test was removed because it didn't accurately represent the real-world performance of graphics cards. If you want to evaluate your GPU, you'll have to use other dedicated benchmarks or upgrade to Cinebench 2024, which does include Redshift-based GPU tests.
Cinebench's built-in results table lets you compare your scores with various reference CPUs. If your processor is performing significantly below expectations, something might be limiting its performance, such as overheating, insufficient power, a misconfigured BIOS, or background processes consuming resources.
What is considered a good score in Cinebench R23?
The notion of a "good score" in Cinebench R23 depends heavily on your intended use . If your primary interest is gaming, the key metric is single-core performance. As a quick reference, a single-core score of over 1000 points can be considered decent for modern games, although current mid-to-high-end models typically exceed this score by a considerable margin.
For 3D rendering tasks and highly parallelizable workloads , the focus should shift to the multi-core score. Any CPU that surpasses 20.000 multi-core points in Cinebench R23 falls into a range where rendering times for complex scenes become quite reasonable. From there, each significant jump in the rankings translates into substantial reductions in minutes or hours of waiting time.
Another interesting piece of information offered by Cinebench R23 is the MP Ratio . This figure represents the ratio between the multi-core score and the single-core score. For example, if you score 1000 points in single-core and 5000 in multi-core, the MP Ratio will be 5 (5000 / 1000).
The multithreading ratio (MP) shows how well your CPU scales when utilizing all cores . Ideally, this ratio would be similar to the number of physical CPU cores. In practice, it's usually lower because the processor can turbocharge more aggressively when only one core is in use, and other bottlenecks (memory, latency, etc.) also come into play. Even so, it's a useful benchmark for determining if you're truly benefiting from multithreading.
In general, if your MP Ratio is close to the number of cores in your processor (or at least a reasonable value based on the architecture design), you can rest assured regarding scalability. If the ratio is very low, there might be some limitations in the system (excessive temperatures, power restrictions, or configurations that affect turbo mode under sustained load).


Passionate writer about the world of bytes and technology in general. I love sharing my knowledge through writing, and that's what I'll do on this blog, show you all the most interesting things about gadgets, software, hardware, tech trends, and more. My goal is to help you navigate the digital world in a simple and entertaining way.