- Pandas is ideal for processing and transforming large-scale data; OpenPyXL excels at formatting, styling, and workbook control.
- Combining both libraries allows you to automate reports: calculations with pandas and layout with openpyxl.
- Optimize performance by reading only necessary columns and using read_only/write_only modes when appropriate.
If you work in data analysis or need to automate repetitive spreadsheet tasks, combining Python with Excel is a winning strategy to accelerate your workflow . Excel remains the dominant tool in many companies, and learning how to prevent it from converting numbers to dates is crucial, while Python provides power, flexibility, and a robust ecosystem of libraries designed for data. In this guide, you'll see, in detail, how to read and process Excel spreadsheets with pandas and openpyxl , when to use each, and how to get the most out of them in real-world situations.
Beyond simply opening a file and looking at a few cells, here you'll learn how to load specific sheets and ranges, filter, transform, and save results , format cells with advanced styles, create new workbooks and sheets, generate automated reports, and even create charts or small dashboards. We'll go from the basics to practical examples, with ready-to-adapt code, and with performance recommendations and best practices to avoid bottlenecks and common errors.
Preparing the environment and necessary libraries
Before you begin, make sure you have a recent version of Python installed; Python 3.7 or higher is recommended to ensure compatibility with the libraries we'll be using. To check your version, you can run the following command in the terminal.
python --versionTo manipulate Excel in Python, the key libraries you'll use are pandas and openpyxl ; each covers different needs. You can install them quickly with pip and start experimenting.
pip install pandas openpyxlIf you prefer to manage dependencies with a manager like Poetry, you can also install both packages with simple commands , for example poetry add pandas and poetry add openpyxl , which helps you maintain a reproducible environment per project without headaches.
Reading books, sheets and cells with openpyxl
The openpyxl library works directly with .xlsx files, allowing you to open workbooks, manipulate worksheets, and read/write cells with precision. It's ideal when you need fine-grained control over formatting , applying styles and formulas, and working with Excel's structure.
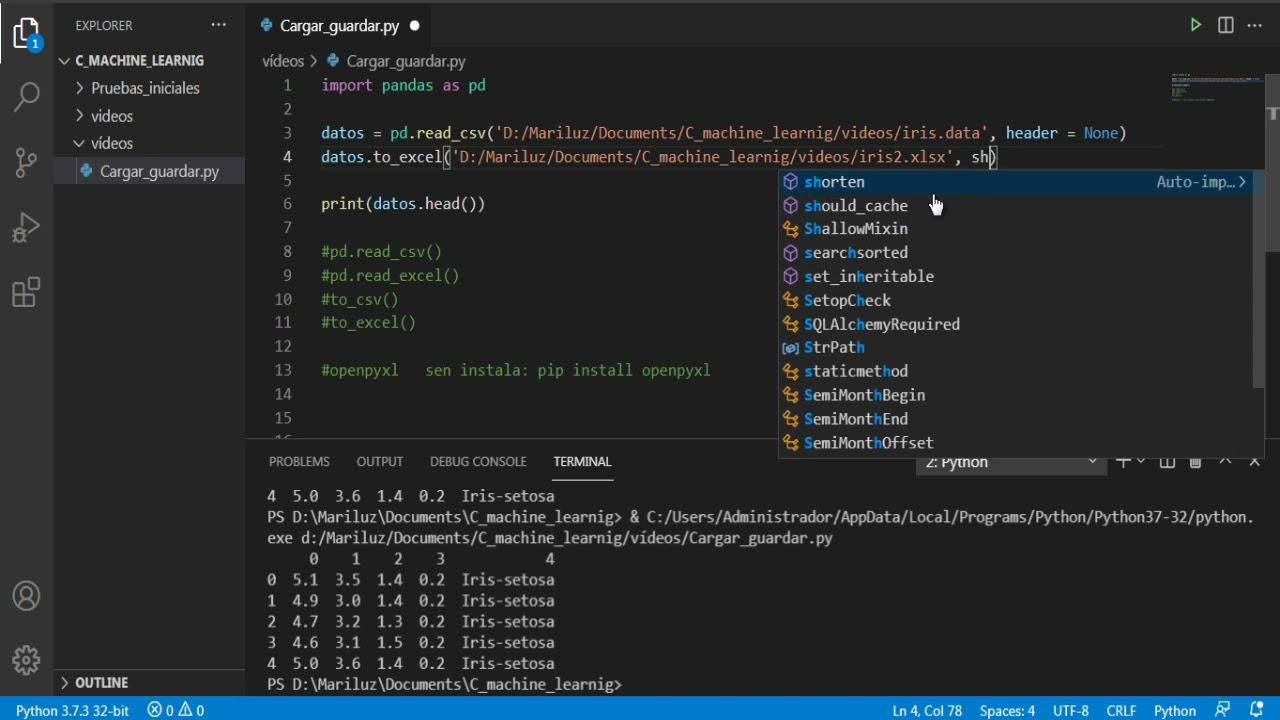
from openpyxl import load_workbook

# Cargar un archivo Excel
workbook = load_workbook("example.xlsx")

# Ver nombres de hojas disponibles
print(workbook.sheetnames)
Once the workbook is open, you can select a sheet by name and view specific values. This approach is useful when you want to inspect individual cells or iterate through ranges without converting everything to a tabular structure.
# Seleccionar una hoja concreta
sheet = workbook

# Leer el valor de una celda
valor = sheet.value
print(f"Valor de A1: {valor}")
To iterate by rows or ranges, `iter_rows` is your best friend. You can narrow down rows and columns and process each cell. If you're only reading, enabling read-only mode reduces memory usage and improves speed on large files.
# Recorrer las primeras 10 filas
for fila in sheet.iter_rows(min_row=1, max_row=10):
    valores =
    print(" ".join(valores))
Read and write data efficiently with pandas
If your goal is data analysis and manipulation , pandas is your best bet. It transforms Excel spreadsheets into DataFrames (powerful tables) for filtering, aggregating, transforming, and exporting results faster than with manual loops.
import pandas as pd

# Leer un Excel a DataFrame
df = pd.read_excel("datos.xlsx")

# Ver las primeras filas
print(df.head())
The read_excel function allows you to load specific sheets, columns, or skip initial rows (very useful for files with complex headers or notes). This gives you control and improves efficiency because you avoid retrieving unnecessary data.
# Hoja específica
df = pd.read_excel("datos.xlsx", sheet_name="Hoja2")

# Importar solo ciertas columnas (por etiqueta de Excel o nombre de columna)
df = pd.read_excel("datos.xlsx", usecols=)  # Por letras

# Omitir filas del principio
df = pd.read_excel("datos.xlsx", skiprows=4)
Once you've finished transforming your DataFrame, you can export it to Excel using a single method. Setting index=False avoids writing the index as an additional column, which is very common when preparing business reports.
# Guardar el DataFrame en Excel
 df.to_excel("datos_procesados.xlsx", index=False)
When to use pandas and when to use openpyxl
Although they complement each other, they don't address the same problem: pandas excels at bulk processing (filtering, aggregations, joins, cleanup), while openpyxl is superior in formatting (styles, borders, widths, formulas, charts, creating/deleting sheets, etc.). Choosing wisely saves you time.
If you need to modify thousands of cells with a simple rule (for example, adding 10% to a column), pandas lets you do it in a single line; with openpyxl, you'll need to iterate through cells using loops and manage references. However, if you want to apply corporate formatting, styles, or add charts within the final Excel file, openpyxl is the better choice.
A very useful strategy is to combine both: process with pandas and, once the final table is generated, use openpyxl to polish the professional finish (bold, centered headers, colors, number formats, etc.). This way you get performance and a presentation-ready result.
Common operations with pandas: selection, filtering, and modifications
With pandas, column selection and conditional filtering are a breeze. This allows you to transform large datasets with vectorized operations without writing loops, resulting in faster and more readable code.
import pandas as pd

archivo_excel = "ejemplo_excel.xlsx"
df = pd.read_excel(archivo_excel)

# Selección de columnas
df_col = df]

# Filtrado por condición
filtrado = df > 10]

# Nuevas columnas y transformaciones
df = df * 2
df = df.apply(lambda x: x + 5)

# Guardar resultado
df.to_excel("resultado_excel.xlsx", index=False)
To inspect only a portion, you can use `.head()` or the `.iloc` indexing method when you need rows/columns by position. Additionally, when exporting, pandas supports multiple formats (CSV, Parcel, etc.), opening up options beyond Excel. It's also common practice to supplement pandas with guides on arithmetic operations in Excel when migrating logic between the two environments.
Reading and editing with openpyxl: from cells to ranges
If the focus is on the Excel document itself, openpyxl lets you create workbooks, add sheets, rename them, and delete those you don't need. This detailed control is essential when you need to adapt to a template's layout or maintain existing formulas.
from openpyxl import Workbook, load_workbook

# Crear un libro nuevo
ewb = Workbook()
ws = ewb.active
ws.title = "Hoja Principal"
ewb.save("nuevo.xlsx")

# Cargar y manipular un libro existente
wb = load_workbook("datos_openpyxl.xlsx")
wb.create_sheet("Nueva Hoja")
del wb
wb.save("datos_openpyxl.xlsx")
Accessing individual cells or ranges is straightforward. You can also read, change values, and write back. For bulk changes, using ranges and understanding Excel's structure will make your work easier.
ws = wb
celda = ws
print(celda.value)

# Modificar valores
ws = "Nuevo Nombre"

# Recorrer un rango
for fila in ws:
    for c in fila:
        print(c.value)
Apply styles, formats, and numbers with OpenPyxl
One of the advantages of openpyxl is that you can customize your report with fonts, borders, padding, and alignment , as well as numeric formatting (such as two decimal places). This is key for reports that will be viewed by non-technical users.
from openpyxl.styles import Font, Border, Side, PatternFill, Alignment

ws = wb

# Estilos
fuente = Font(name="Arial", size=12, bold=True, color="FF000000")
borde = Border(left=Side(style="thin"), right=Side(style="thin"),
               top=Side(style="thin"), bottom=Side(style="thin"))
relleno = PatternFill(start_color="FFFF0000", end_color="FFFF0000", fill_type="solid")

# Aplicar a una celda
c = ws
c.font = fuente
c.border = borde
c.fill = relleno
c.alignment = Alignment(horizontal="center", vertical="center")
c.number_format = "0.00"  # Dos decimales

wb.save("datos_openpyxl.xlsx")
You can also enter Excel formulas directly into cells, which will be recalculated when the file is opened in Excel. Be aware of common Excel formula errors , which often occur when mixing code-generated data with spreadsheet logic.
ws.value = "=SUM(A1:B1)"
wb.save("datos_openpyxl.xlsx")
Simple charts and visualizations in Excel with OpenPyxl
To complete a report, you sometimes need to include a chart within the workbook itself. With openpyxl, you can create bar charts, line charts, or other types of charts from data ranges and place them in a specific location.
from openpyxl.chart import BarChart, Reference

chart = BarChart()
datos = Reference(ws, min_col=1, min_row=1, max_col=2, max_row=5)
chart.add_data(datos, titles_from_data=False)
ws.add_chart(chart, "E1")
wb.save("datos_openpyxl.xlsx")
Report Automation: Combining Pandas and OpenPyxl
A very useful approach is to process data with pandas (totals, averages, groupings) and export the results to a new workbook, which you then format with openpyxl to deliver a well-formatted report . This pattern scales well for recurring reports.
import pandas as pd
from openpyxl import Workbook
from openpyxl.styles import Font, Alignment

# Leer ventas
ventas = pd.read_excel("ventas.xlsx")

# Agregaciones
por_producto = ventas.groupby("Producto").sum()
promedio = ventas.mean()

# Crear libro de reporte
wb = Workbook()
ws = wb.active
ws.title = "Reporte de Ventas"

# Cabeceras
ws = "Producto"
ws = "Total Ventas"
ws = "Promedio Ventas Mensual"

enc = Font(bold=True)
for celda in ("A1", "B1", "C1"):
    ws.font = enc
    ws.alignment = Alignment(horizontal="center")

# Datos
fila = 2
for producto, total in por_producto.items():
    ws = producto
    ws = total
    ws = promedio
    fila += 1

wb.save("reporte_ventas.xlsx")
If you also want to ensure visual consistency, add thin borders and number formatting to the amount columns. This way, your report is ready to be shared without manual adjustments in Excel; and if you need to automate the data entry, you can use techniques to automatically fill data based on patterns.
Typical processes: filtering, transforming, and saving with Pandas
A common use case is filtering by a condition and saving the result to a new file. This can be done in just a few lines of code with pandas and is ideal for data cleaning or preparation pipelines for business teams.
import pandas as pd

df = pd.read_excel("example.xlsx")

# Filtrar ventas > 1000
filtrado = df > 1000]

# Guardar sin índice
filtrado.to_excel("filtered.xlsx", index=False)
print("Archivo guardado")
If you need to keep an original column and create a modified one (for example, adding 10% to "Total Area"), the vectorized operation avoids loops and leaves you with a clean and easy-to-inspect DataFrame.
df = pd.read_excel("cultivos.xlsx")

df = df
df = df * 1.1

# Mostrar primeras 10 filas a partir de la tercera columna
print(df.iloc)
If you also prefer to temporarily hide results in the final file instead of deleting them, consider rules to hide rows based on cell value to facilitate team review.
Deleting rows and cleaning data
Another common task is deleting records by position or condition. With pandas, deleting the first 10 rows is straightforward using the index; for more complex filters, use boolean expressions without for-loops.
df = pd.read_excel("cultivos.xlsx")

# Quitar las 10 primeras filas por índice
df.drop(df.index, inplace=True)
print(df.head(10))
If your cleanup relies on rules like "delete rows with an even Total Area," you can create a condition and apply it, keeping your code expressive and maintainable rather than relying on loops and manual counters. And if the sheet is protected, remember how to unprotect a password-protected Excel sheet before modifying it.
Editing and deleting with openpyxl: cells and rows
When working with openpyxl, modifying an entire column involves traversing through cells. The advantage is that you can insert new columns, maintain the original layout , and save to another file without breaking the formatting.
from openpyxl import load_workbook
from openpyxl.utils import get_column_letter

wb = load_workbook("cultivos.xlsx")
ws = wb

# Insertar columna G y titularla
ws.insert_cols(7)
ws = "Area Total Modificada"

# Sumar 10% a la columna F y guardar antiguo valor en G
for fila in ws.iter_rows(min_row=2):
    valor_antiguo = None
    for celda in fila:
        col = get_column_letter(celda.column)
        if col == "F":
            valor_antiguo = celda.value
            celda.value = float(celda.value) * 1.1
        if col == "G":
            celda.value = valor_antiguo

wb.save("cultivos_modify.xlsx")
To delete rows by position, openpyxl also solves it with one call, although for advanced conditions you will have to iterate and decide what to delete based on the content of each row.
wb = load_workbook("cultivos.xlsx")
ws = wb

# Eliminar las 10 primeras filas (ajusta idx si hay cabeceras)
ws.delete_rows(idx=1, amount=10)
wb.save("cultivos_modify.xlsx")
Consolidate multiple Excel files into one
A classic scenario: you have dozens of .xlsx files with the same schema and you want to combine them into a single table for analysis. With pandas and glob, you can do it in a couple of lines, without manually opening each file.
import pandas as pd
import glob

excel_files = glob.glob("*.xlsx")

# Concatenar todo en un DataFrame
todos = pd.concat(, ignore_index=True)

todos.to_excel("consolidated_data.xlsx", index=False)
This approach is perfect for monthly integrations, multi-delegation reports, or any process where you receive multiple books with a homogeneous structure.
Generate reports by department automatically
From a file containing overall sales data, you can segment by department and automatically generate a customized report for each one . Each file is then ready to be shared with your team.
import pandas as pd

sales = pd.read_excel("sales_data.xlsx")
departamentos = sales.unique()

for dpto in departamentos:
    df_dpto = sales == dpto]
    df_dpto.to_excel(f"{dpto}_report.xlsx", index=False)
If you also need to format each report, you can load the resulting file with openpyxl and style headers , adjust column widths, and add a corporate color. You can also automate file organization and create cascading folders and subfolders for each department.
Small interactive dashboard with Tkinter and pandas
For rapid prototyping, you can create a simple window that displays columns and calculates the average of the selected one. It's not a full-fledged BI tool, but it works for quick validations without leaving Python.
import tkinter as tk
import pandas as pd
from tkinter import messagebox

file = "data.xlsx"
data = pd.read_excel(file)

def calcular_media():
    col = listbox.get(listbox.curselection())
    media = data.mean()
    messagebox.showinfo("Resultado", f"Promedio en {col}: {media:.2f}")

root = tk.Tk()
root.title("Dashboard interactivo")

listbox = tk.Listbox(root)
listbox.pack()
for c in data.columns:
    listbox.insert(tk.END, c)

btn = tk.Button(root, text="Calcular promedio", command=calcular_media)
btn.pack()

root.mainloop()
For more complex reporting projects, you might want to move this to a web app with Streamlit or Dash , but for a quick local utility, Tkinter can get you out of a bind with very little code.
Exploratory Analysis: Statistics and Graphics with Pandas + Matplotlib
When your Excel spreadsheet contains customer or sales data, it's helpful to take a quick look at distributions and relationships. Pandas can provide descriptive statistics, and Matplotlib can generate very useful histograms and scatter plots .
import pandas as pd
import matplotlib.pyplot as plt

clientes = pd.read_excel("clientes.xlsx")

# Estadísticas generales
print(clientes.describe())

# Histograma de edades
clientes.hist(bins=20)
plt.xlabel("Edad")
plt.ylabel("Frecuencia")
plt.title("Distribución de edades")
plt.show()

# Dispersión ingresos vs satisfacción
clientes.plot.scatter(x="Ingresos", y="Satisfaccion")
plt.xlabel("Ingresos")
plt.ylabel("Satisfacción")
plt.title("Ingresos vs. Satisfacción")
plt.show()
This allows you to identify extreme values, biases, or interesting relationships for further investigation. If you want to report this in Excel, export summary tables using pandas and create in-book charts with openpyxl for a polished deliverable. For specific statistical analyses, you can also consult the quartile function in Excel as a reference when migrating indicators.
Saving results with pandas and openpyxl
With pandas, writing to Excel is instantaneous; plus, you have the advantage of exporting to other formats like CSV or Parse. If the file is for business use, add sheets with different details or data filtered by segments within the same workbook.
df = pd.read_excel("cultivos.xlsx")

df = "SI"
df.to_excel("cultivos_modify_pandas.xlsx", index=False)
If you work with openpyxl, remember that you can create new columns and populate them by range. This is a straightforward way to mark reviewed records in reports with a fixed structure.
from openpyxl import load_workbook

wb = load_workbook("cultivos.xlsx")
ws = wb

ws = "Revisado"
for celda in ws:
    celda.value = "SI"

wb.save("cultivos_modify_openpyxl.xlsx")
Performance and good practices
For large files, it's best to limit the amount of data you load into memory. In pandas, read only the necessary columns using `usecols` and avoid processing irrelevant columns. In openpyxl, use `read_only=True` for reading and `write_only=True` for writing.
Pay attention to data types: Excel sometimes saves numbers as text, which can break filters and aggregations. When loading with pandas, you can specify dtypes or normalize columns after reading to avoid surprises with dates, amounts, or IDs.
When using Excel formulas, remember that not all functions are supported equally by libraries; they will most likely be recalculated when opened in Excel . If you need fixed values, first evaluate them with pandas and then write the calculated numbers.
For compatibility, prioritize .xlsx files (modern format) and test your scripts with different versions of Excel when your users have heterogeneous environments. This reduces issues caused by functions or features not supported in older versions.
Finally, think about reproducible pipelines: set dependencies (Poetry, requirements.txt), document your parameters (sheet_name, usecols, skiprows), and add minimal logs for debugging. You'll save time when the project scales or the data source changes.
If you've made it this far, you've already mastered reading, processing, and writing Excel data with pandas and openpyxl. You know when to use each tool and how to combine them for professional reports. From now on, you'll see your spreadsheets as both sources and destinations within a robust, automated, and much faster workflow.

Passionate writer about the world of bytes and technology in general. I love sharing my knowledge through writing, and that's what I'll do on this blog, show you all the most interesting things about gadgets, software, hardware, tech trends, and more. My goal is to help you navigate the digital world in a simple and entertaining way.