- HWMonitor displays temperatures, voltages and fans with current, minimum and maximum values.
- It allows to detect thermal peaks and voltage drops that anticipate failures of hardware.
- It's free and portable; the PRO edition adds graphics and advanced organization.
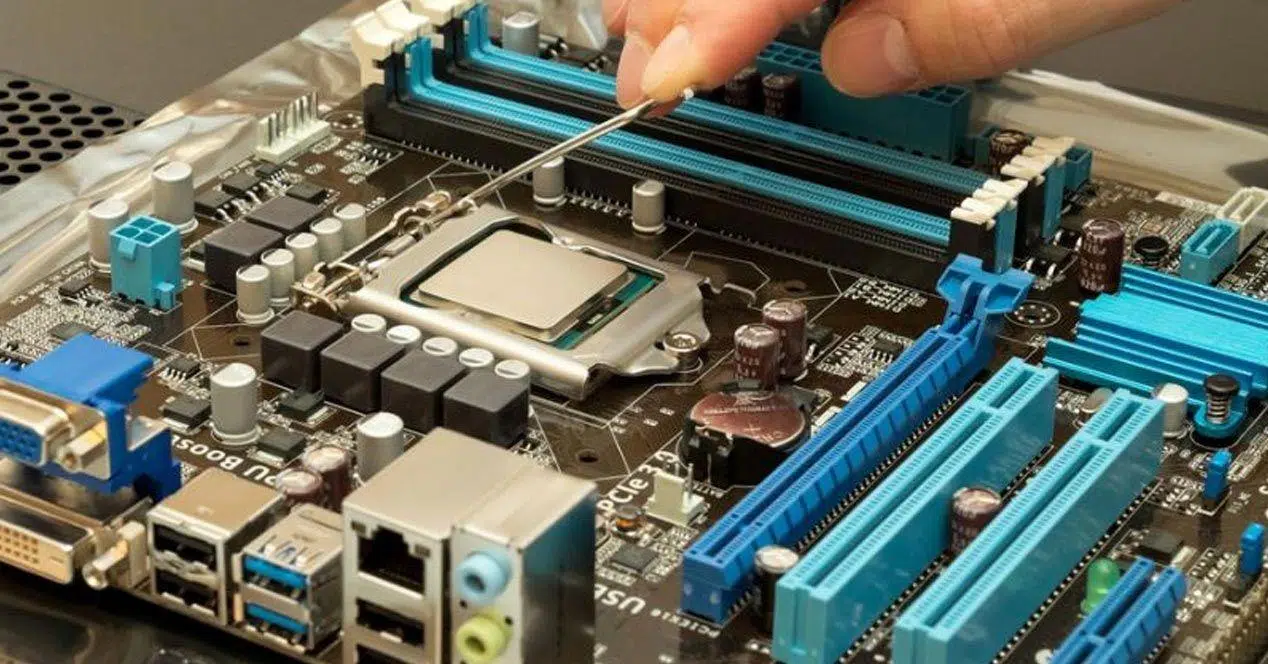
If you're concerned about your PC's health, real-time monitoring of temperatures, voltages, and fan speeds is essential to prevent problems and keep performance running smoothly. HWMonitor is one of those tried-and-tested, lightweight, and straightforward tools that lets you see what's happening inside your system without complicating things with advanced settings.
In this guide, you'll learn how to install and use HWMonitor, interpret key readings, and identify out-of-range values that could indicate overheating, power supply failures, or cooling problems. You'll also find practical tips for getting the most out of it, whether you're overclocking or just want your computer to run smoothly every day.
What is HWMonitor and what data does it offer you?
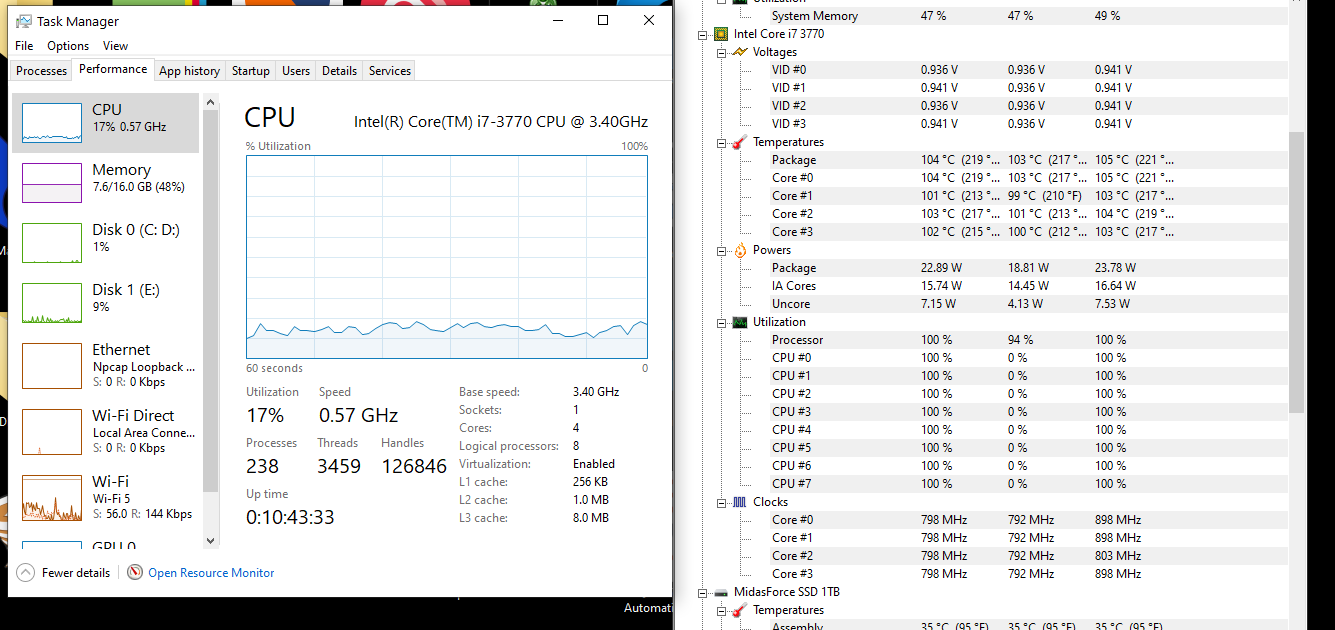
HWMonitor (from CPUID, the creators of CPU-Z) is a sensor monitor that displays the Actual (Value), Minimum (Min), and Maximum (Max) values of each component in columns. It doesn't attempt to inventory the hardware like other utilities; its purpose is to reflect the readings obtained by the integrated sensors.
Among the parameters you'll be able to see are the temperatures of the CPU, GPU, hard drives, SSDs , and other motherboard chips; the main voltages; fan speeds; CPU/GPU usage and frequencies ; and even battery data for laptops . All of this is displayed in a very simple tree view, with sections that you can expand with the + symbol and collapse with the – symbol.
Its greatest strength is its compatibility: it reads sensors on Intel and AMD platforms, NVIDIA and AMD graphics cards , many motherboards, and most modern storage drives . Thanks to this broad compatibility, it's useful in both desktop and laptop computers, from basic PCs to workstations.
Another interesting feature is that each section groups readings by device: you'll see the name of your motherboard, processor, graphics card, or each hard drive, and under each one, its sensors are listed with current, minimum, and maximum values since you opened the program. This three-column system makes it much easier to detect thermal spikes or sudden voltage drops.
Download, installation and portable version
Go to the official CPUID website and choose between the installer (SETUP) or the portable ZIP package . If you don't want to install anything, the ZIP version is ideal: simply extract it and run the 32-bit or 64-bit binary directly , depending on your system. No dependencies or lengthy wizards.
When you open the folder, you'll find two executable files: HWMonitor_x32 and HWMonitor_x64. Choose the one that corresponds to your Windows version , and you're all set. On modern computers, the x64 version is usually used . If you prefer to install it, the SETUP file provides a shortcut and the typical integration with the Start menu.
There's also a paid version, HWMonitor PRO . It offers the same sensor capabilities but adds presentation features: creating historical graphs, reordering sections, and renaming sensors for a more organized interface. For most users, the free version is sufficient, but if you're looking for graphs and customization , the PRO version can save you time.
Interface and Getting Started: Where to Look
The interface is minimalist. At the top, you'll find a classic menu with File, View, Tools, and Help; below, a tree view of all devices and sensors. There are no widgets or complex panels: its philosophy is clarity and speed.
In the File menu, you can export the data to a text file and exit the program. This is useful if you're sending a report to support or want to archive the readings from a test session.
The View menu allows for some display settings and a dark theme . Keep in mind that dark mode is partial: it mainly applies to the list of values, so the interface isn't completely uniform, although it is more comfortable in low-light environments.
Within the Tools menu, you have three quick access options: change the temperature units (Celsius or Fahrenheit), check for a new program version, and open a page to check for driver updates (this redirects to an external utility). There are no other controls; everything revolves around viewing readings, not modifying them.
Temperatures: How to Measure Them and What They Mean
Temperatures are the primary indicator of health. You'll see the reading for each CPU core , as well as the "Package" (the entire chipset). It's normal to see differences between cores, and during heavy loads, temperature spikes will be reflected in the Max column.
For a modern CPU, a good target under heavy load is to stay below ~80°C . It's not a problem to see slightly higher peaks for a few seconds, but if the current temperature remains stuck at the maximum, you should check the cooling, thermal paste, or case ventilation.
On the GPU, especially when gaming or rendering, try to keep the sustained temperature from exceeding 85°C . Some cards are designed to withstand higher temperatures, but pushing them to the limit reduces their lifespan and can cause throttling, which is automatic frequency reductions to prevent overheating.
Hard drives and SSDs typically operate at lower temperatures. A reasonable range is 30–60 °C , depending on the chassis and workload. If they frequently exceed this range, you may need to improve airflow or space the drives further apart.
If your motherboard includes additional sensors (PCH, VRM, "Motherboard"), HWMonitor will list them. Not all of them are accurately labeled by the firmware, but they help detect hotspots in the system: if you see one of these values spike compared to the others, it's a sign of insufficient airflow or a fan malfunctioning.
Voltages: stability, risks and how to interpret them
The other major section of HWMonitor is voltages. For CPU and GPU, you'll see lines like Vcore or the graphics chip voltage, and for motherboard, you'll see the power supply rail values: 12V, 5V, and 3.3V . Keeping these voltages within their specified range is crucial to prevent crashes or intermittent freezes.
A significant drop in the 12V reading under heavy load can indicate a worn-out or poor-quality power supply. The same applies to the 5V and 3.3V readings: if they deviate significantly from their nominal values and you see this reflected in the Min column , it's cause for concern. Conversely, excessively high voltages degrade components over time . If you need to delve deeper into how to detect hardware failures , these types of readings are key to diagnosis.
On some systems, you'll see multiple voltage lines without clear labels. This is common: the firmware exposes sensors with generic names, and HWMonitor lists them as is. What matters is observing consistency and dismissing suspicious spikes. If you're adjusting profiles in the BIOS or overclocking, pay close attention to Vcore and associated temperatures.
Fans, frequencies and power consumption
The fans connected to the motherboard are displayed with their RPM . If a line drops to zero when the system is hot, it's a clear red flag: that fan is either stopped or not properly connected. Many temperature problems can be explained by a simple loose connector.
In the processor and GPU section, you'll see the clock speeds and per-core usage. This is very useful for checking if the CPU's turbo boost remains stable or if the GPU is being limited by temperature or power. If you overclock, this is invaluable for verifying that the system can handle your performance profile.
Some configurations also display package power and, in the case of storage drives, the transfer speed in MB/s. Not all controllers display this data, but if it is available, it helps you understand the relationship between load, power consumption, and temperature.
On laptops, HWMonitor can display the battery's status: detection, input voltage, declared capacity versus actual capacity, and percentage of wear. If you see high wear or unusual voltage fluctuations, it's a good time to consider a replacement.
How to measure and monitor methodically
To properly evaluate your system, open HWMonitor and let it record Min/Max values while you do what you usually do: play games, edit video, render, or run a short stress test . Then come back and look: the peak values tell the real story, beyond the value you see at that moment.
If you're diagnosing power outages or blackouts, try to reproduce the scenario. Observe if, just before the failure, there's a sharp temperature spike or voltage drop. There are no automatic alerts, so you'll have to interpret the situation yourself. Use the three values (Value/Min/Max) for context.
Remember that proper ventilation is also crucial. The same PC can run 5–10°C cooler with a well-ventilated case and clean filters. If temperatures have worsened over time, consider cleaning and applying thermal paste before replacing half your system.
Reference ranges: what is normal and what is not
Safe operating temperatures vary across CPUs and GPUs. As a general guideline, many modern Intel and AMD CPUs idle below 40°C , operate smoothly in the 50–70°C range under moderate load, and can reach nearly 80°C under heavy load. For current gaming GPUs, 65–80°C is typical during gameplay, with slightly higher peaks depending on the specific model and fan profile.
In older generations , such as some AMD FX series or i5/i7 processors from several iterations ago, the maximum limits reported by manufacturers are lower than those of current chips. This diversity explains why you'll find tables with specific examples from different families (i3, i5, i7, and A-series APUs, as well as various FX series ) showing typical idle and load temperatures, along with the recommended maximums. Use these as a general guideline: the key is that your chip doesn't remain consistently near its limit.
Occasionally exceeding these limits doesn't mean immediate catastrophe, but it does shorten the lifespan and trigger protection mechanisms (throttling or even shutdown). If you find that your equipment is consistently operating above reasonable limits, it's time to take action using the measures outlined in the practical sections.
Common use cases
For overclockers, HWMonitor is an essential tool. While you adjust multipliers and voltages, it monitors whether the temperature and Vcore remain within safe limits during heavy loads. A system that passes a synthetic benchmark but overheats in games may indicate thermal limitations in the case or the CPU cooler.
In diagnostics, it's perfect for isolating problems. Does your PC shut down unexpectedly? Check the Min/Max columns: a 12V drop , a stopped fan, or a spiked VRM temperature will tell you more than a thousand guesses. On laptops, checking the battery can explain performance drops due to insufficient sustained power.
For preventative maintenance, a monthly check helps detect trends: temperatures that rise over time often indicate accumulated dust, dried-out thermal paste, or fans with worn bearings. You'll avoid surprises if you act when the problem starts to appear , rather than when it's too late.
Limitations to keep in mind
HWMonitor doesn't control anything: you can't change voltages, fan curves, or apply profiles from the app. Its focus is on displaying readings, which for many users is an advantage because it prevents potentially dangerous adjustments . If you're looking for more control, you'll have to combine it with BIOS/UEFI tools or manufacturer-specific utilities.
It also doesn't automatically alert you when a value goes out of range. That's why it's important to know the reasonable margins and critically review the spikes in the Max column. On the other hand, the program is lightweight and stable , with negligible resource consumption even on older computers.
Practical comparison and tricks
Compared to more comprehensive solutions like HWiNFO, HWMonitor prioritizes simplicity: just open it and read. If you also want to overlay metrics on the screen while gaming, a typical approach is to use a third-party overlay and reserve HWMonitor for testing sessions and recording minimum/maximum values.
A useful trick: leave HWMonitor open in the background during a long work or gaming session. When you're finished, mentally organize what you saw and note the peaks that appear in Max. If you don't trust your memory, use the export option and save a file for each session to compare the trends.
What to do if something is out of range
If temperatures are rising, start by cleaning the filters and fans, making sure they're all spinning, and checking the heatsink pressure. Replacing the thermal paste on the CPU/GPU periodically makes a difference, especially on systems that haven't been maintained for years.
If the problem is voltage stability, consider the power supply. A 12V line with abnormally low voltage often indicates a PSU that needs replacing. Before buying, check the connections and rule out unsafe adapters . For laptops, consider the condition of the charger and battery.
When the bottleneck is airflow , rearrange fans and cables, improve air intake/exhaust, and if the case is very enclosed, consider a chassis with better ventilation. A couple of well-placed fans can lower even the most stubborn temperature readings by several degrees.
HWMonitor stands out for being free, portable, and accurate in what matters most: seeing what's happening inside your PC in real time. With its Value/Min/Max readings , extensive compatibility, and straightforward interface, it's become an almost indispensable tool for monitoring temperatures, voltages, fans, and frequencies. Used judiciously, it helps you prevent problems, fine-tune your system, and detect any dangerous deviations early on.


Passionate writer about the world of bytes and technology in general. I love sharing my knowledge through writing, and that's what I'll do on this blog, show you all the most interesting things about gadgets, software, hardware, tech trends, and more. My goal is to help you navigate the digital world in a simple and entertaining way.