- The BSOD They generate dump files that allow the identification of drivers, hardware or system files involved in the failure.
- Tools like WinDbg, WhoCrashed, and BlueScreenView make minidump analysis easy without requiring advanced knowledge.
- RAM testing, hardware review and commands DISM/SFC/chkdsk are key to resolving persistent stability issues.
- Faulty drivers and conflicting updates Windows They are the usual culprits behind recurring blue screens.

Seeing a blue screen of death appear just as you're finishing up an important task is one of those things that ruins your day. Suddenly, the computer restarts, you see a strange error code (if you need to interpret error codes ), perhaps mentioning something like pci.sys, MEMORY_MANAGEMENT, or DRIVER_POWER_STATE_FAILURE , and you have no idea where to begin. And to top it all off, many times the system recovers on its own and the error doesn't reappear for quite a while, making it even harder to figure out what happened.
The good news is that Windows leaves behind much more information than meets the eye. Each BSOD generates one or more dump files that we can analyze with tools like WinDbg, WhoCrashed, or BlueScreenView to determine which driver, component, or system file actually caused the problem. By combining this analysis with some hardware tests and system repair commands, it's possible to diagnose the source of most blue screens with considerable accuracy.
What exactly is a BSOD and why does it occur?
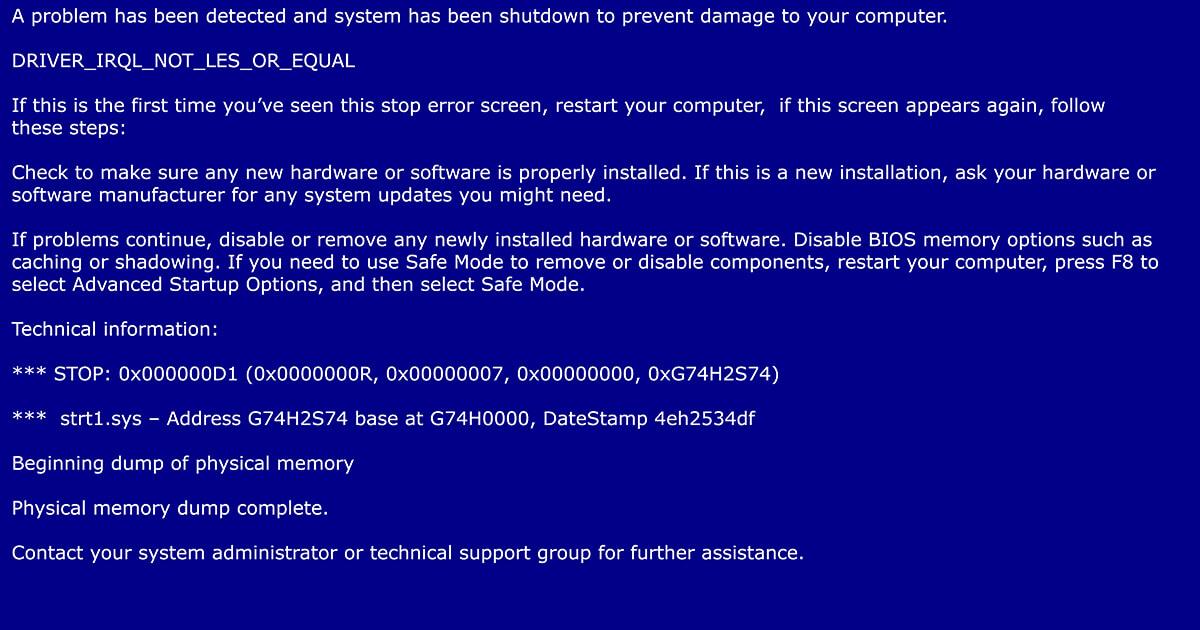
When a BSOD appears, what's happening behind the scenes is that Windows has detected a situation so critical that it can no longer run safely . Instead of continuing and potentially corrupting data, it decides to stop everything, display the blue screen, and create a memory dump of the system's internal state at that moment.
At the bottom of the blue screen , a stop code (bug check) usually appears, and in many cases, an involved file is listed, such as pci.sys, hidusb.sys, or ntfs.sys . This code always has four associated parameters (hexadecimal values) that provide more context about the failure. Although only a summary is displayed on the screen, this data is saved in the system and in dump files.
A faulty, poorly programmed, or outdated driver is a very common cause of a Blue Screen of Death (BSOD). In fact, it's estimated that three out of four blue screens are driver -related . The rest usually stem from hardware failures (RAM, hard drive, graphics card, motherboard), power or temperature issues, or even corrupted system files.
There are cases where the error is clearly associated with a specific file, for example, a graphics driver that fails on a gaming laptop and causes a BSOD when the GPU drivers load. Or errors where the culprit is identified as pci.sys , the PCI bus controller that coordinates communication between the hardware and Windows.
Where are the BSOD dump files stored?
Whenever the system encounters a critical error, Windows creates one or more dump files that store information about the failure. You'll typically have at least one minidump file in the C:\Windows\Minidump directory . These files are usually named with a date, allowing you to identify which one corresponds to the most recent blue screen.
In addition to the minidump, a larger dump (kernel or full) can be generated and saved to C:\Windows\MEMORY.DMP . This file is larger but provides more detail for in-depth debugging with advanced tools like WinDbg.
Some Windows diagnostic tools or troubleshooters also use temporary files stored in user paths, for example in C:\Users\YourUsername\AppData\Local\Temp , where additional information about the crash is collected for automatic reporting.
If you want to prevent the blue screen from disappearing on its own, it's recommended to disable automatic restart. In the advanced system settings, you can uncheck the box for " Automatically restart on failure." This will give you time to note the stop code and ensure a complete system backup.
Interpreting a BSOD by analyzing dump files with WinDbg
The most effective way to understand a blue screen is to load the dump file into Microsoft's debugging tools. This allows you to see exactly what code was running, which controller was involved, and what parameters the error contained, instead of just relying on the generic message displayed on the screen.
Microsoft offers the Debugging Tools for Windows as part of its development kit. Within this package is WinDbg, the main debugger that allows you to open dumps in both user mode and kernel mode. There are versions for 32-bit and 64-bit systems, so you need to download the one appropriate for your Windows installation.
Once installed, simply run WinDbg, go to File > Open Crash Dump , and select the most recent minidump file located in C:\Windows\Minidump. The program will load the file, scan the symbols (this may take a while the first time), and display a wealth of technical information about the cause of the BSOD.
In the WinDbg command window, you can use the ` !analyze -v` extension , which performs a detailed analysis of the dump. Among other data, you'll see the bug check, its four parameters, and a very interesting line that usually says something like "Probably caused by: xxxx.sys". That file, typically a driver, is the prime suspect in the crash. For code examples and their interpretation, you can also consult specific cases such as error 0x0000000A.
In certain scenarios, the debugger itself displays examples like a bugcheck 0x9F (DRIVER_POWER_STATE_FAILURE) with parameters similar to {3, ffffe000…, fffff803…, ffffe000…} , indicating that the hidusb.sys driver (related to HID USB devices ) caused the failure while handling a power state change. This information is invaluable for knowing which component to target first.
Other tools for analyzing dumps without complicating your life
Not everyone wants to wrestle with WinDbg and advanced commands. Luckily, there are simpler utilities that read the same dump files and display a clear summary, ideal for home users or technicians who want to work quickly without getting bogged down in low-level details.
One of the best-known is WhoCrashed . This application analyzes minidumps and presents a report in more human-friendly language, indicating which device or driver is most likely the cause of the crash. It translates vague errors like IRQL_NOT_LESS_OR_EQUAL or similar and identifies the executable or .sys file involved.
WhoCrashed lets you view a history of crashes, the dates of each crash, and a brief explanation of each one. When you see, for example, that three different BSODs point to the same network driver, graphics driver, or antivirus module , you already have a clear clue as to where to start uninstalling, updating, or checking.
Another very useful tool is BlueScreenView . This program automatically scans all minidumps generated by Windows and lists them in a table with data such as the date, error code, four parameters, and the drivers loaded at the time of the failure.
BlueScreenView highlights in red the drivers that were present in the stack when the crash occurred, making it easier to pinpoint which .sys file is suspicious. It also displays the product name, description, file version, etc., helping to identify whether it corresponds to a motherboard driver, graphics card driver, a specific USB device, and so on.
Using Driver Verifier to hunt for problematic drivers
Since many BSODs are caused by faulty drivers, Windows includes a specific tool to stress them and reveal incorrect behavior. It's called Driver Verifier and comes integrated into the operating system, ready to use on any Windows computer.
To open it, simply type "verifier" in a console or search box. A wizard will open where you can create a standard or custom configuration. An interesting option is to select unsigned drivers , as these are often the most prone to problems, especially if they come from unreliable sources.
Driver Verifier adds extra checks to driver code (memory usage, IRQL management, etc.) and, if it detects illegal behavior, deliberately triggers a Blue Screen of Death (BSOD) with specific information so the fault can be investigated. Therefore, it's recommended to only enable the drivers you want to examine to avoid excessive impact on system performance.
This tool is geared more towards developers and technicians, but it can also be used to diagnose a troublesome home computer where blue screens always point to third-party drivers or poorly integrated software.
Analyze stop codes and bug check parameters
Each type of blue screen is identified by a symbolic name (for example, DRIVER_POWER_STATE_FAILURE, MEMORY_MANAGEMENT, IRQL_NOT_LESS_OR_EQUAL…) and a numerical value (BugCheck code) such as 0x9F, 0x1A, 0xD1, etc. Both are documented in the official Microsoft bug check code reference.
Alongside this code are four hexadecimal parameters that provide further context. These parameters can indicate the memory address involved, the type of operation that failed, the affected object, or the device's state. All of this information is displayed in both the debugger and the Windows event log.
If you don't want to open a dump, you can also access the Event Viewer (eventvwr.msc), go to the system log, and look for BugCheck events. In the event properties, you'll see the stop code and its parameters, allowing you to at least determine what type of error occurred and search for it in the Microsoft database or online.
When a debugger is connected in kernel mode, the system stops directly in it when error checking occurs. In these cases, you might not even see the traditional blue screen. Instead, you'll have all the details of the error in the debugger window and can replay the information with commands like ` .bugcheck` or ` !analyze -v`.
BSODs related to RAM and system boot
A very common cause of blue screens is RAM problems. During startup , the BIOS POST performs a superficial check of the memory modules, and if it detects anything unusual, it can prevent the system from booting or cause errors once Windows is loading. Fast restarts can also result in errors when the RAM hasn't fully discharged and corrupted data remains.
In many scenarios, even if you initially see a memory management error, the PC will eventually boot after one or two attempts. This doesn't mean everything is working correctly: you might experience other random BSODs or seemingly unrelated crashes during normal use, all caused by the same faulty memory.
Furthermore, it's important to note that aggressive overclocking, both on the RAM and the processor's integrated memory controller (IMC), can trigger intermittent stability issues . Sometimes the PC appears stable and only fails during startup or while the system attempts to load something critical into memory.
On the other hand, although many people first suspect the motherboard, a serious defect in a memory slot often prevents the computer from even booting or performing POST, so in many cases BSOD problems associated with Memory Management point more to damaged modules, incorrect configurations, or unstable overclocking.
How to check RAM when BSODs appear
The first thing to do if you suspect memory issues with your blue screens is to run a dedicated RAM test. Windows includes its own tool, and there are also much more comprehensive third-party utilities that run before the operating system loads.
The built-in system option is called Windows Memory Diagnostic . You can open it by typing "Memory Diagnostic" or "mdsched" in the search bar. When you run it, it will offer to restart your computer immediately to run the test, or schedule it for the next startup. If you're already experiencing BSODs, it's best to restart now and run the test.
During the restart, you'll see a blue and gray screen with the tool running. It allows you to choose between several scan modes: Basic (quick but not very thorough), Standard, and Extended. If you want to be on the safe side, it's best to select at least Standard mode, or Extended if you don't mind it taking significantly longer.
When the test is complete, Windows will restart, and you should see a notification with the scan results when you log in. If it indicates that memory errors were detected, it's very likely that you have one or more faulty memory modules and should consider replacing them.
To pinpoint the exact faulty module, you can turn off your computer, remove one of the RAM sticks, and repeat the tests module by module . If the system works perfectly with one module and becomes unstable when you install the other, you've identified the culprit and simply need to replace that module with one that has the same specifications and is compatible with your motherboard.
Memtest86 and other advanced RAM tests
If the Windows tool doesn't show any errors but you're still getting suspicious blue screens, it's advisable to use a more comprehensive memory test like Memtest86 . This utility runs from a bootable USB drive, so the check is performed before loading the operating system and with all RAM completely free.
The typical procedure is to download the Memtest86 image, write it to a USB drive, select the boot device in the BIOS, and let the program perform several passes. It scans all memory addresses , applying different read and write patterns to try to force errors that a superficial test might miss.
If Memtest86 or Windows diagnostics show errors, it's almost certain there's a physical problem with the RAM or that the overclocking is excessive. In that case, it's recommended to disable any XMP/EXPO profiles or custom frequencies and revert to the factory settings to repeat the tests and see if the instability disappears.
You can also repeat the same testing method for individual modules, booting your PC with only one stick at a time and letting Memtest86 do its work. It's slow, but very effective at isolating the faulty component and eliminating recurring memory-related BSODs.
Check physical hardware: RAM, disks, graphics card and cooling
Although dump files provide a lot of information, it never hurts to take a physical look inside the computer. A simple loose connector, accumulated dust, or a poorly installed heatsink can trigger all sorts of errors, including blue screens of death that initially seem mysterious.
Start by ensuring all internal connections are secure : RAM modules properly seated, SATA and power cables without slack, graphics card firmly in its PCIe slot, etc. Any loose connection can cause a device to momentarily disappear and trigger driver errors.
Temperature is also a key factor. An overheating processor or graphics card can cause crashes, restarts, and blue screens. It's advisable to clean the dust from inside the computer, check that the fans are spinning correctly, and ensure the processor heatsink is properly secured with fresh thermal paste if it's been on for many years.
If you suspect a hard drive or SSD , you can use tools like chkdsk and the manufacturer's utilities to check for bad sectors and SMART status, as well as errors like WHEA Uncorrectable Error . In extreme cases, for example in a RAID 0 array where a disk is suddenly disconnected, the BSOD (Blue Screen of Death) can point to hardware problems related to the NTFS file system and clearly indicate that the root cause is in the storage.
From Device Manager (devmgmt.msc), you can check for devices with yellow warning icons. These symbols indicate that the system has detected conflicts or problematic drivers . Right-clicking on a device will allow you to try updating drivers, temporarily disabling the device, or running the built-in troubleshooter.
Checking and repairing system files
When memory tests come back clean and the hardware appears to be in order, you should start looking at Windows itself. A corrupted or damaged system file can cause anything from minor errors to full-blown BSODs, especially during startup or when loading certain drivers.
Windows includes several commands for examining and repairing both the system image and individual files. A very effective combination is to first use DISM to scan the image and then SFC to check the integrity of the files . All of this is done from a command prompt with administrator privileges.
To begin, open Command Prompt as administrator and run the following commands one after the other, waiting for each to finish before running the next:
DISM / Online / Cleanup Image / ScanHealth
DISM / Online / Cleanup Image / CheckHealth
DISM / Online / Cleanup Image / RestoreHealth
SFC / scannow
DISM is responsible for checking and, if necessary, repairing the Windows image used as a basis for restoring components. Once the image is healthy, SFC analyzes each system file and, if it detects any corrupt ones, automatically replaces them. This process can take some time, but it resolves many stability issues related to seemingly random BSODs (Blue Screens of Death).
In addition to DISM and SFC, it's worth running a disk scan with `chkdsk /f /r` . This command checks the disk's logical structure, marks bad sectors, and relocates data if possible. Since it can't perform all operations with Windows running, it will ask if you want to schedule the scan for the next restart, to which you should reply yes.
Memory Management errors and other persistent blue screens
Memory Management Blue Screens of Death (BSODs) are among the most dreaded because they can have multiple causes. They can stem from a faulty RAM module, a poorly managing memory controller, aggressive overclocking, or corrupted system files. That's why it's so important to follow a systematic diagnostic process : check the RAM, inspect the hardware, run repair tools, and if nothing works, consider more drastic changes.
If you continue to experience these types of blue screens after all the memory and system tests, it's a good idea to try a different RAM kit , even a borrowed one, to completely rule out the current modules as the problem. You can also reset the BIOS to default settings, disable overclocking profiles, and ensure that the frequencies and voltages are within the official specifications of the processor and motherboard.
In very challenging scenarios, the problem can originate in the CPU's integrated memory controller (IMC), especially when working with very high-frequency memory or configurations outside of officially supported specifications. Sometimes this can be resolved by slightly increasing the corresponding voltage; other times, it's necessary to lower the RAM speed to stabilize the system.
As a last resort before you go crazy, you can always restore or reinstall Windows . If you're still seeing the same memory errors after a clean install, you can almost certainly focus on hardware (RAM, CPU, or motherboard) as the main culprits.
Impact of Windows updates on BSODs
Windows is designed to work on a huge range of hardware configurations, unlike more closed systems like macOS. This means that an update that works perfectly on one computer can cause instability on another with older drivers, an outdated BIOS, or very specific components.
It's not uncommon for a blue screen to start appearing right after installing a specific Windows Update patch . If you've noticed this timing, it might be a good idea to review your update history and uninstall the last update that was installed before the problems began.
To do this, go to Settings > Update & Security > Windows Update and then to View update history > Uninstall updates . There you will see a list of all installed updates and their date. Identify the most recent one, right-click on it, and choose Uninstall.
Once the process is complete, it's advisable to restart your computer even if Windows doesn't explicitly prompt you to. This ensures that all traces of the update are removed and that the system boots to its previous state. If the BSODs disappear after removing a patch, you now know what was causing them and can decide whether to wait for a new patch or look for an updated driver that makes it compatible.
Additional tips for technicians and developers
If you develop drivers or software that's very close to the system, sooner or later you'll encounter blue screens caused by your own code. In that context, the essential tool is the kernel debugger (WinDbg in kernel mode) connected to the test machine, whether via network, USB, or serial port.
When a bug check occurs under these conditions, the system doesn't necessarily display a blue screen to the user. Instead, it stops within the debugger, providing all the error information instantly. From there, you can set breakpoints before the critical point, review the call stack, examine internal structures, and correct the code leading to the violation.
It's also advisable to use tools like Driver Verifier to force extreme memory and resource usage scenarios. If your driver doesn't pass these tests, it's only a matter of time before a real user experiences a BSOD because of it, so it's best to deliberately create and correct these errors in a lab environment.
For problems that aren't related to your own code, the best approach is to isolate and remove the software or hardware component that's actually causing the issue. Often, basic diagnostic procedures are sufficient: checking file dates, reinstalling drivers, disabling third-party programs (such as Voicemeeter ), and using tools like Sysinternals, the Event Viewer, or network monitors to narrow down the root cause.
Ultimately, understanding and analyzing BSOD dump files allows you to go beyond a simple "PC has frozen" and determine if the culprit is a specific driver, faulty RAM, a hard drive with damaged sectors, a conflicting update, or an overclocked device. With this information, the chances of restoring stability to the computer and preventing the blue screen from becoming your new constant companion increase significantly.


Passionate writer about the world of bytes and technology in general. I love sharing my knowledge through writing, and that's what I'll do on this blog, show you all the most interesting things about gadgets, software, hardware, tech trends, and more. My goal is to help you navigate the digital world in a simple and entertaining way.
Table of Contents
- 1 What exactly is a BSOD and why does it occur?
- 2 Where are the BSOD dump files stored?
- 3 Interpreting a BSOD by analyzing dump files with WinDbg
- 4 Other tools for analyzing dumps without complicating your life
- 5 Using Driver Verifier to hunt for problematic drivers
- 6 Analyze stop codes and bug check parameters
- 7 BSODs related to RAM and system boot
- 8 How to check RAM when BSODs appear
- 9 Memtest86 and other advanced RAM tests
- 10 Check physical hardware: RAM, disks, graphics card and cooling
- 11 Checking and repairing system files
- 12 Memory Management errors and other persistent blue screens
- 13 Impact of Windows updates on BSODs
- 14 Additional tips for technicians and developers