- Activate the memory dumps and disables auto-reboot to capture critical information from the BSOD.
- With BlueScreenView you can identify the module involved (“Caused By Driver”) and review drivers loaded and bugcheck parameters.
- When you need extra precision, use WinDbg with Symbols from Microsoft or a web service to analyze minidumps.
When Windows freezes, the dreaded blue screen appears, and the computer restarts without warning, it's normal to feel like you're in the dark. With a simple tool like BlueScreenView, you can pinpoint the cause of the problem and make informed decisions.
In this guide, we'll explain in detail and without beating around the bush how to understand what happened, how to enable memory dumps to avoid losing valuable information, and how to read those minidumps with BlueScreenView. Furthermore, if you want to go a step further, we'll explore alternatives like WinDbg and a web service to enhance your diagnostic capabilities.
What is a blue screen of death (BSOD) and why does it appear?
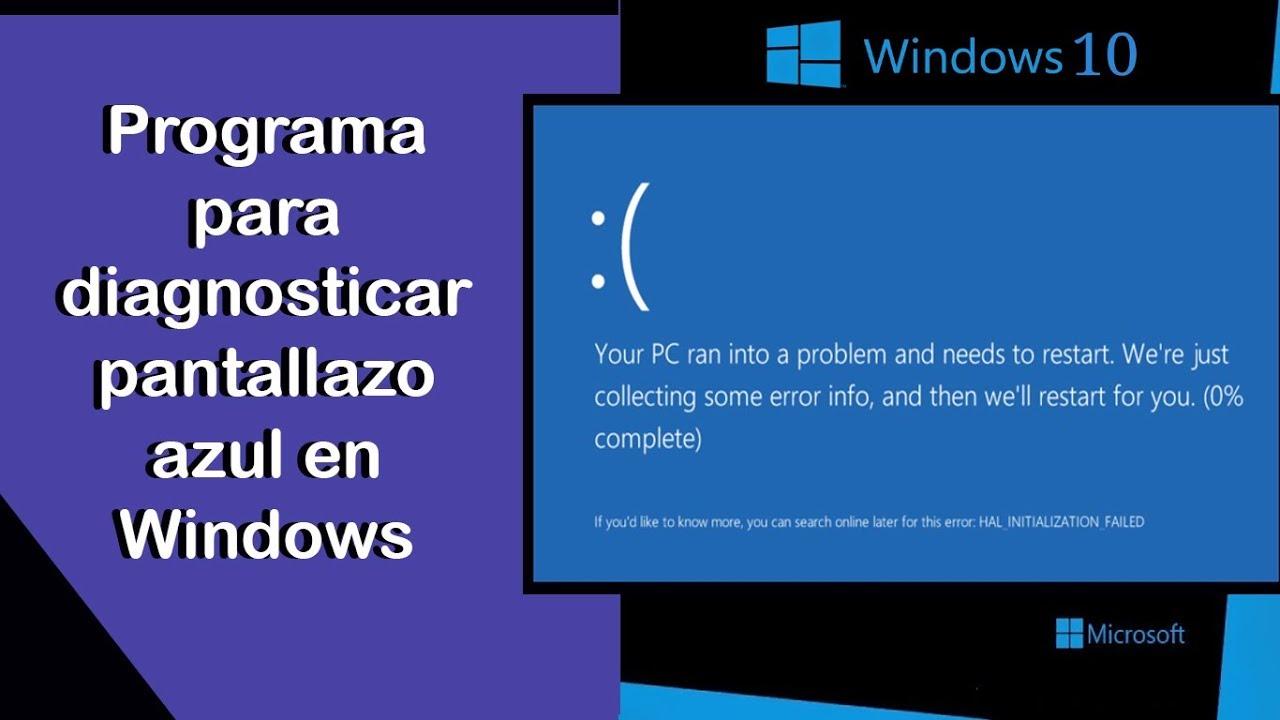
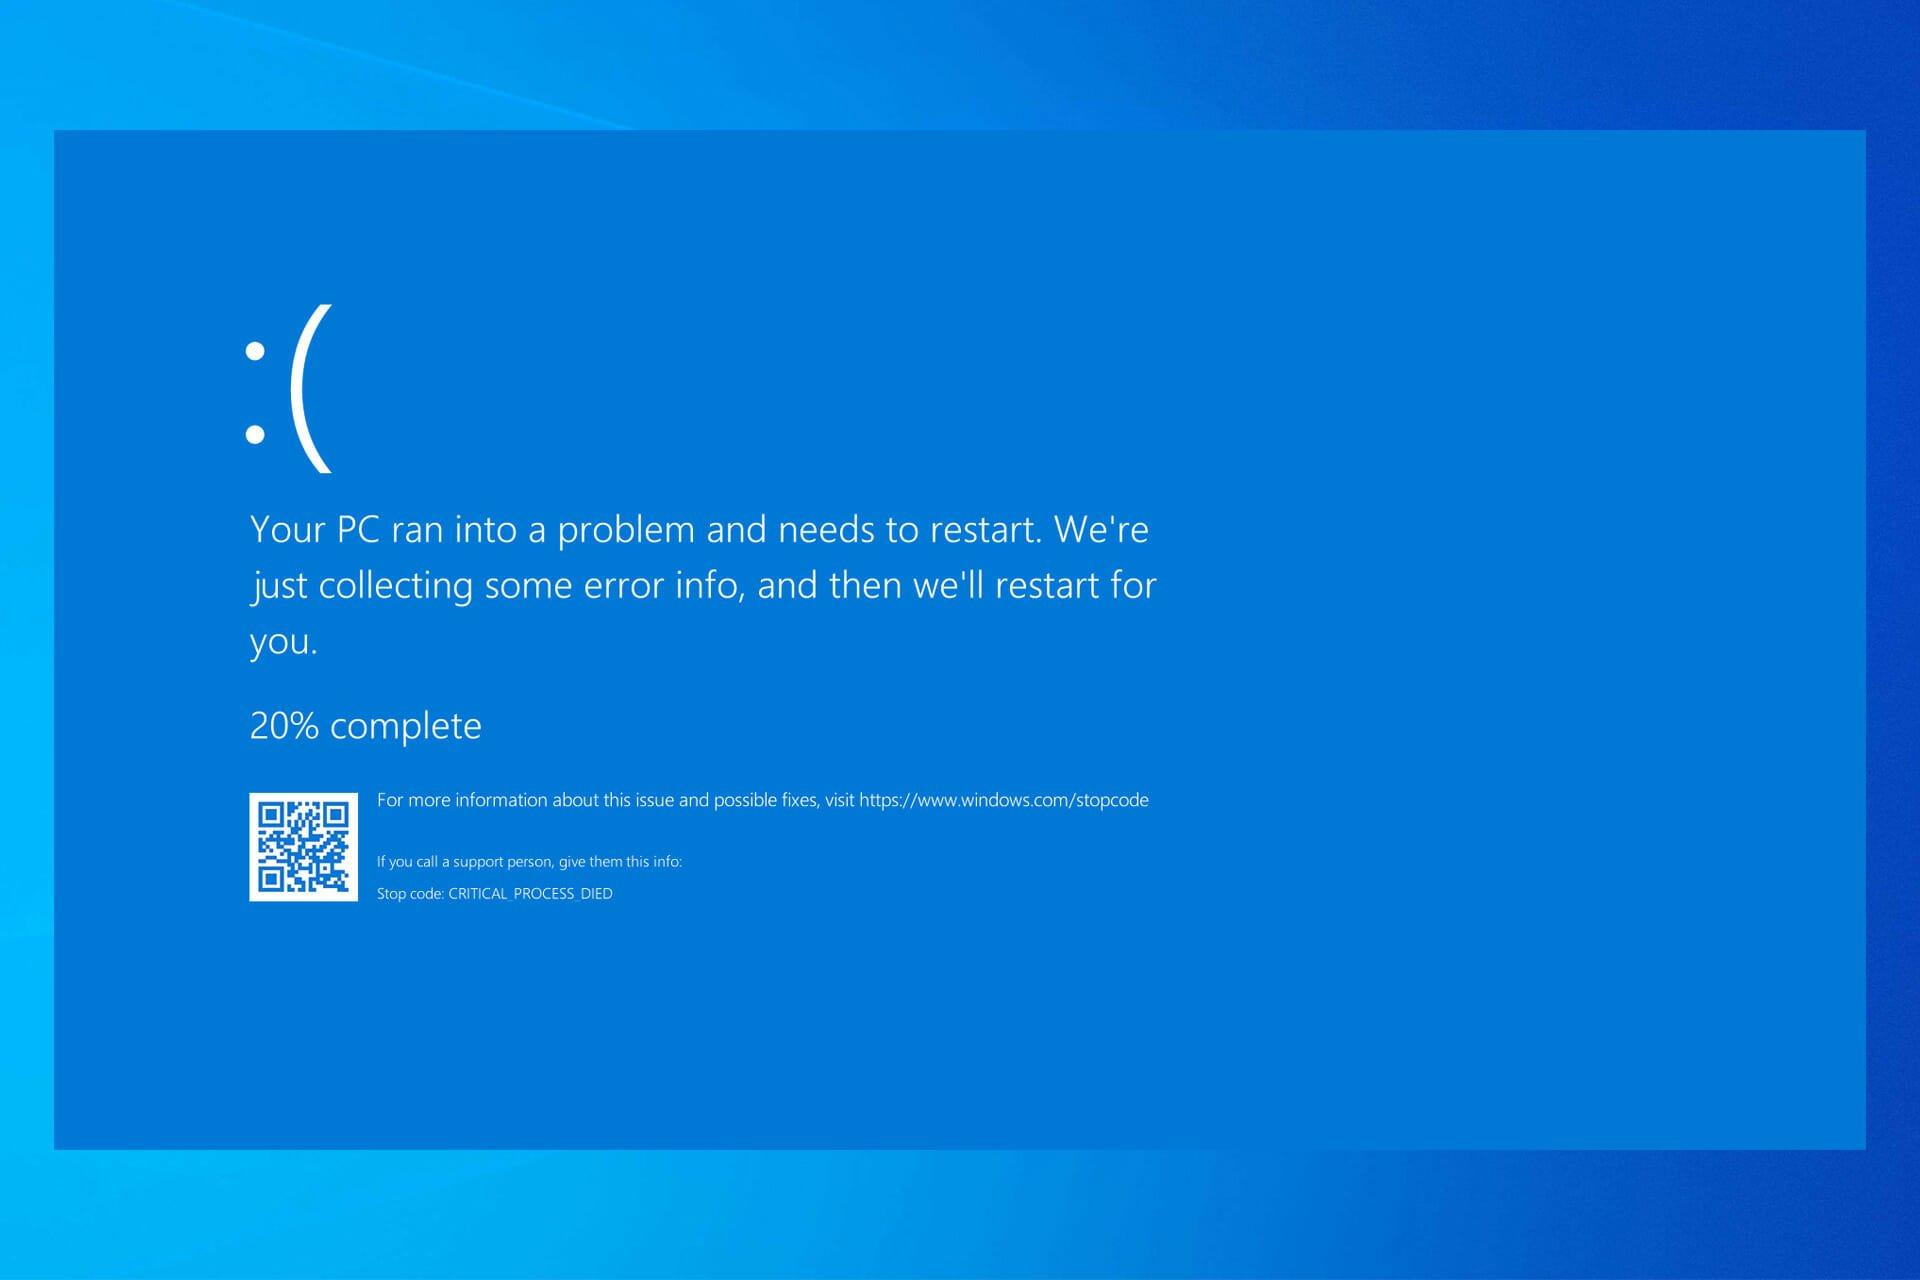
The infamous BSOD (Blue Screen of Death) isn't just a random error: it's Windows' built-in safety mechanism, triggered when it detects a critical error that prevents normal operation . To protect the system and data, Windows shuts down, creates a memory dump of the error, and restarts the computer.
On that screen, you'll see a stop or STOP code, often consisting of four alphanumeric blocks separated by commas, and sometimes also the name of the module or controller involved. A single screen error might be insignificant, but if it recurs, it's time to investigate.
The most common causes of a BSOD include software and hardware problems . The following are some of the most important and should be kept in mind to guide the investigation from the outset:
- DLL incompatibilities or system libraries: with ThereWhen installing and updating programs, an application may load a different version than expected and disaster may occur.
- Faulty drivers, poorly installed or incompatible drivers, as well as conflicts between hardware devices.
- Faulty hardware or in poor condition, from RAM to problematic disks or peripherals.
- Overheating of components due to dirt, poor ventilation or continuous demand.
- Lack of maintenance both the system (software) and the equipment (hardware), which aggravates latent errors.
- Excessive pressure on the RAM which leads to a collapse of the system due to lack of resources.
- Malware or exploits that trigger error conditions in the kernel or drivers.
Important: Reinstalling Windows is rarely a magic solution. If the underlying cause persists, the blue screens will return after formatting. The smart approach is to identify the source using tools that decipher the technical information Windows stores after the crash.
Enables memory dumps and prevents automatic reboot
To investigate a screenshot, you need to gather clues. Windows can create a dump file of what was happening in memory right when the crash occurred, but if this feature isn't enabled, there's nothing to analyze . Additionally, it's advisable to disable automatic restarts so you can examine the screen carefully.
Follow these quick steps from any modern Windows system: Open Run ( Windows + R) , type control system, and press Enter to access System Information. In Control Panel, go to Advanced system settings , and in the "Startup and Recovery" section, click Settings.
There you'll find several key options. Uncheck " Automatically restart " to prevent your computer from restarting without warning after a Blue Screen of Death (BSOD), and under "Write debug information," choose " Automatic memory dump ." This will cause Windows to save a minidump using the page file, without taking up extra space unless necessary.
Very important: The Windows paging file must be on the same partition as the system (usually C:\Windows ) for the dump to be written correctly. If you moved it to another drive or disabled it, re-enable it on that drive.
Keep in mind that if you choose full dumps, the size can be considerable. With 16 GB of RAM, a dump can easily exceed that size, so don't be surprised if many users disable dumps to save space. If BlueScreenView can't find any files, check these options and try again.
Where are they saved? Minidumps usually appear in C:\Windows\Minidump , while the large Windows 10 and later dump is typically saved in %systemroot%\MEMORY.DMP . If you've never taken a screenshot on that computer, or if you recently cleaned the folder, the tool won't show any entries.
BlueScreenView: Downloading, managing, and reading minidumps
BlueScreenView is a free utility from NirSoft that reads the memory dumps created by Windows when a Blue Screen of Death (BSOD) occurs. It's available as a portable (no installation required) version and supports 64-bit systems: download it, extract it to a folder, and run it. In seconds, you'll have a clear view of what happened.
The window is divided into two sections. The top section displays all the screenshots recorded by the system, along with their date, code, and the files involved. Selecting one updates the bottom section, showing the drivers and libraries that were loaded in memory during the crash.
BlueScreenView highlights suspicious items in red , meaning those that likely triggered the error. Look at the "Caused By Driver" column: there you'll see the name of the module that caused the crash, for example, ntoskrnl.exe or variants like ntkrnlpa.exe when the system kernel is involved.
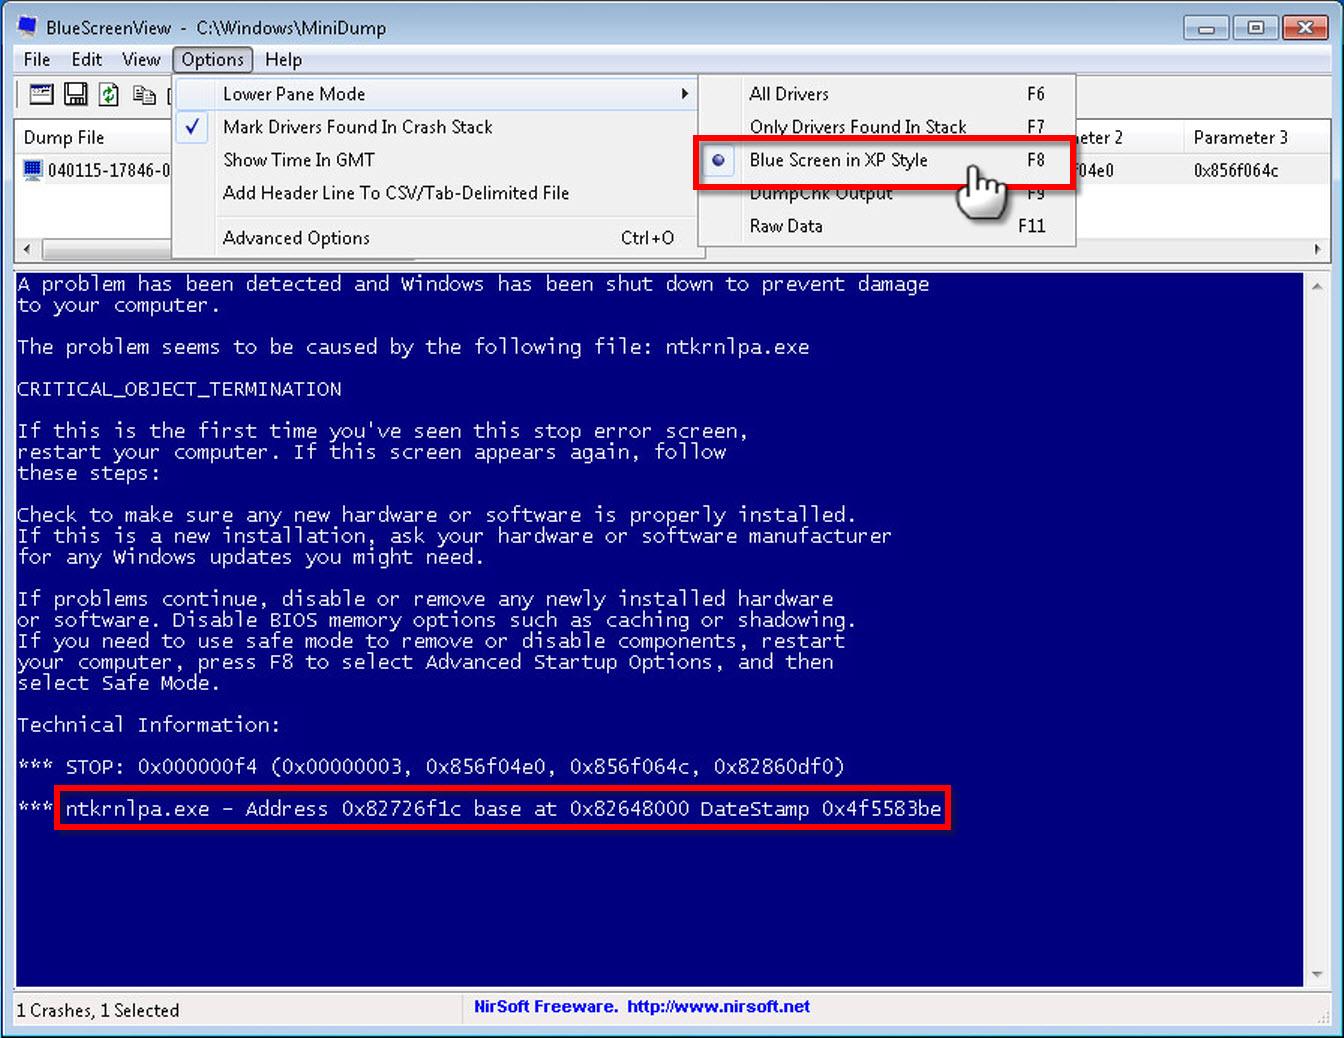
A very useful trick: press F8 within the program to display a replica of the original blue screen in the bottom panel. Pressing F6 then switches the bottom panel to list all loaded drivers, which is crucial for understanding the context of the failure and identifying conflicts.
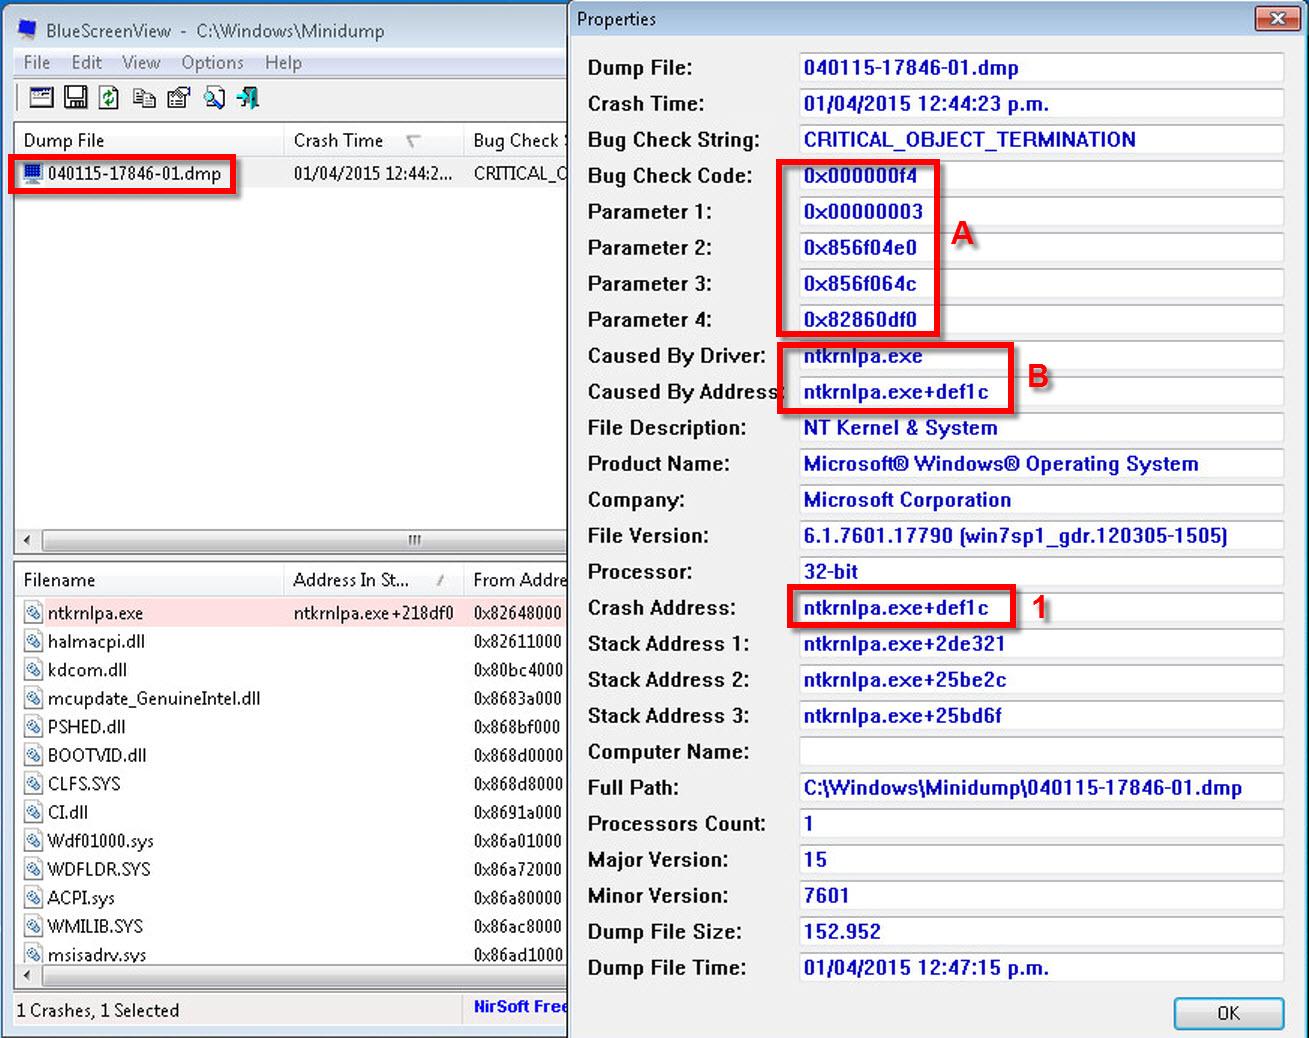
Double-click on the BSOD log at the top to open a box with more extensive information: you will see the bugcheck parameters (the four values that accompany the STOP), the associated module, the memory address of the crash, the operating system version, and the disk path of the driver or file that is thought to be responsible.
If you double-click on a specific library at the bottom, another window will appear with details about the memory segment, load time, size, and other metadata that will help you narrow down your investigation . Often, this cross-referencing of data will tell you whether the problem lies with an external driver, a third-party DLL, or something within Windows itself.
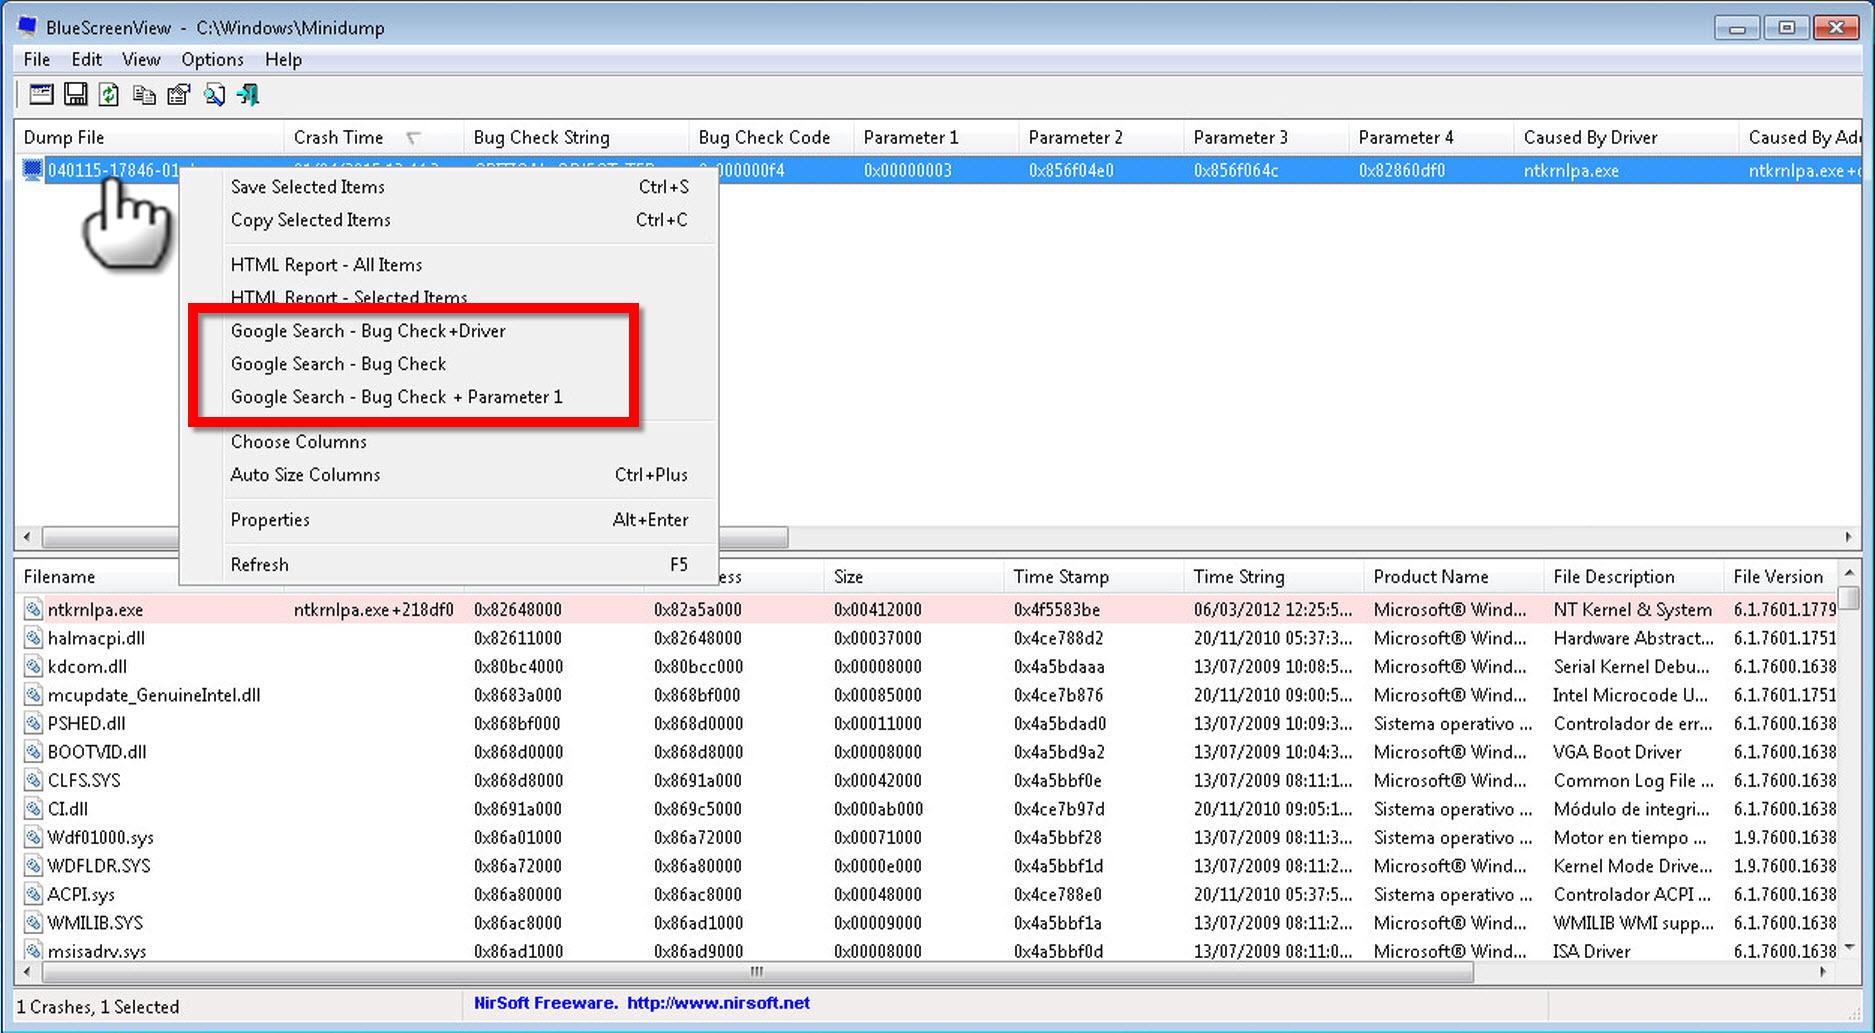
And if you get stuck, right-click on the error and use the option to search the internet directly for the code or module name. You'll find threads and documentation with identical or very similar cases. Interestingly, if you encounter the "Nt_Wrong_Symbols" error, it usually indicates problems with the Wi-Fi adapter or its driver package.
It's important to emphasize that BlueScreenView doesn't fix anything; it's used to identify the cause . The solution will involve updating or reinstalling drivers, reverting problematic software, repairing system files, or checking hardware, depending on what you discover through the analysis.
Beyond BlueScreenView: WinDbg and Web Services
Sometimes, BlueScreenView falls short or identifies the kernel (ntoskrnl.exe) as the victim instead of the actual culprit. The Event Viewer isn't much help either, as it barely shows the date of the crash. When precision is needed, it's best to use more powerful debugging tools like WinDbg.
WinDbg is part of the Microsoft SDK. You don't need to install everything: the " Debuggers and Tools " components for your architecture (x86 or x64) are sufficient. After installation, open WinDbg and configure the Microsoft symbol path so that it correctly resolves functions and structures.
Go to File > Symbol File Path and paste the following to download symbols on demand: SRV*c:\websymbols*http://msdl.microsoft.com/download/symbols . Click Reload to load the symbols. This step speeds up and improves the analysis, especially with dumps from updated systems.
Now open the .DMP file (File > Open Crash Dump) and, once loaded, run the command !analyze -v in the WinDbg console. You will get an expanded report with the process involved, resource allocation, the symbolic name of the crash, the module flagged, and many more clues to arrive at a high-fidelity diagnosis.
If you prefer not to install anything, there's a web service that analyzes minidumps directly in your browser, with results similar to WinDbg. Upload the file and you'll get a reading of the most likely causes—very handy when you're away from your computer or want a quick second opinion.
In parallel, apply typical diagnostic measures to nip the problem in the bud: uninstall recently added programs, remove new hardware to rule out conflicts, revert to a stable restore point, try a safe mode boot , or perform a clean boot by disabling non-essential third-party services.
Don't forget the security aspect. Some screenshots may conceal malware that has compromised its integrity or an exploit that has created race conditions within the system. Security labs recommend always analyzing the environment , verifying system integrity, running a reliable antivirus scan, and considering audits if there are serious indications of vulnerability.
When the analysis points to third-party drivers, the most effective solution is usually to download the latest version from the manufacturer's website (don't rely solely on the generic Windows updater), or even install an older version known for its stability if the latest one is causing problems. And if the kernel appears to be the culprit, look around: the kernel often absorbs the damage, but the initial cause is usually elsewhere.
Finally, don't underestimate the role of heat and dust. A thorough check of your system to improve ventilation, replace thermal paste on older machines, or test your RAM with diagnostic tools can save you hours of headaches when the root of the problem is purely physical.
With a good dump setup, BlueScreenView for a first look, and WinDbg/web services for deeper analysis, you'll have a fairly accurate picture of what's happening. From there, a combination of driver updates, reverting changes, system repairs, and hardware checks will almost always lead to a stable and trouble-free system.

Passionate writer about the world of bytes and technology in general. I love sharing my knowledge through writing, and that's what I'll do on this blog, show you all the most interesting things about gadgets, software, hardware, tech trends, and more. My goal is to help you navigate the digital world in a simple and entertaining way.