- Always compile with -go -ggdb so that GDB displays lines, variables, and functions in a readable way.
- Use breakpoints (simple and conditional) along with run, next, step, and continue to control execution.
- It combines print, list, backtrace, and watchpoints to inspect variables, memory, and the call stack.
- Take advantage of keyboard shortcuts and info commands to debug complex C and C++ programs faster.
If you program in C or C++, sooner or later you're going to run into bugs that can't be caught just by... printf and trial and errorThat's when GDB stops being "that weird command" and becomes an essential tool for understanding what your program is really doing line by line.
In this comprehensive guide, we'll see how to use GDB with ease: from how to compile your code with debug symbols, to how to place breakpoints, inspecting variables, moving through the stack and take advantage of keyboard shortcuts. All from the terminal, with practical examples and clear explanations, so you can debug properly and stop blindly chasing errors.
What is GDB and why is it worth using?
GDB (GNU Debugger) is the standard debugger of the GNU ecosystem It is primarily used with C and C++, although it also supports other languages. It works on pre-compiled executables and allows you to "peek" into your program while it's running, see what happens when it crashes, and manipulate its execution.
Unlike debugging with on-screen messages, GDB allows Stop the program at any point, examine memory, variables, stackYou can change values on the fly and resume execution. All of this is done through a very old but incredibly powerful command-line interface.
GDB has existed since the beginning of Unix and, like other classic tools, gcc or g ++It was designed to work directly in the terminal, without a graphical interface. Today there are frontends with windows and buttons, but once you master the basic commands, most developers end up being faster using GDB "raw".
A typical scenario where GDB shines is when your program explodes with a dreaded Segmentation fault (SIGSEGV)Without a debugger, you only see that something has accessed invalid memory; with GDB, you can find out which line it crashed on, which function was running, and what each important variable contained at that moment.
Compile programs for debugging with GDB
For GDB to work properly, the executable must include debugging information: variable names, functions, lines of source code, etc. This is achieved by adding specific options to the compiler, as our guide explains. Complete tutorial of the gcc command and its key options.
The minimum requirement is to compile with the option -gFor example, if you have a file crash.c With a bug, you can generate a binary called crash with:
gcc -g -o crash crash.c
The option -g It doesn't change the program's logic; it only adds metadata so that GDB can show you the source code, the exact lines, and the actual variable names in the stack frames. The executable file is slightly larger, but it's totally worth it.
In projects where you want to use the C99 standard and continue debugging comfortably, you can combine options such as:
gcc -std=c99 -g -o test test.c
If you use C++ or want a tighter integration with GDB, many guides recommend -ggdb, which generates specific debugging information for this debugger:
g++ -ggdb -o programa main.cpp otras.cpp
In summary: whenever you debug a binary with GDB, make sure you have compiled it with -go -ggdbOtherwise, you'll see memory addresses and cryptic symbols instead of readable functions and lines.
First contact: Start GDB and run your program
Once you have the executable with symbols, you can start GDB in two ways: by launching the "empty" debugger or by specifying the binary you want to analyze. The second method is more common. You start and debug the executable in a single step.
To load and debug, for example, a binary called crash:
gdb crash
You'll see a header with the GDB version, copyright and license notice, and then the typical prompt:
(gdb)
From that prompt you can run your program with the command run (Or simply r):
(gdb) run

Starting program: ./crash
If your program expects standard input, GDB will pass it as is. If instead of specifying the executable at startup you only launched gdbYou can associate a binary later with the command fillet:
(gdb) file memsim
To exit GDB just write quit or its abbreviation qIf the program is running, GDB will ask for confirmation to end debugging.
Practical example: hunting a Segmentation fault
Let's look at a classic example to understand the workflow. Imagine a C program that asks for a number, calculates the sum of 1 and any, displays the result, but contains a memory fault:
#include <stdio.h>
#include <string.h>
#include <stdlib.h>

char *buf;

int sum_to_n(int num) {
    int i, sum = 0;
    for (i = 1; i <= num; i++)
        sum += i;
    return sum;
}

void printSum() {
    char line;
    printf("enter a number:\n");
    fgets(line, 10, stdin);
    if (line != NULL)
        strtok(line, "\n");
    sprintf(buf, "sum=%d", sum_to_n(atoi(line)));
    printf("%s\n", buf);
}

int main() {
    printSum();
    return 0;
}
Something's clearly fishy, but if you run it as is, simply compiling and running it will reveal the disaster:
gcc -g -o crash crash.c

./crash

enter a number:

5

Segmentation fault
The system only warns of one invalid memory accessThat's all. Now, if you run the program within GDB, you can see much more detail. Load the binary and run it:
gdb crash

(gdb) run

Starting program: ./crash

enter a number:

10
When a fault occurs, GDB notifies you with the corresponding signal:
Program received signal SIGSEGV, Segmentation fault.

0x0017fa24 in _IO_str_overflow_internal () from /lib/tls/libc.so.6
To find out what led you there, you use the command backtrace (o bt):
(gdb) backtrace

#0  0x0017fa24 in _IO_str_overflow_internal() from /lib/tls/libc.so.6

#1  0x0017e4a8 in _IO_default_xsputn_internal() from /lib/tls/libc.so.6

#2  0x001554e7 in vfprintf() from /lib/tls/libc.so.6

#3  0x001733dc in vsprintf() from /lib/tls/libc.so.6

#4  0x0015e03d in sprintf() from /lib/tls/libc.so.6

#5  0x08048487 in printSum() at crash.c:22

#6  0x080484b7 in main() at crash.c:28
The trace shows that main called printSum, which in turn called sprintfFrom there, a chain of internal libc functions led to the crash. We cannot touch the implementation of sprintfbut we can see what parameters we passed in line 22 of crash.c.
Breakpoints, step-by-step execution, and basic commands
The beauty of a debugger is being able to stop execution where you need to. That's what debuggers are for. breakpoints, which stop the program just before executing a line or when entering a function.
In the previous example, we want to see what happens just before calling sprintfWe can put a breakpoint on line 22 of crash.c directly from GDB:
(gdb) break crash.c:22

Breakpoint 1 at 0x804845b: file crash.c, line 22.
If you rerun the program with runGDB will notify you that it's already running and ask if you want to start from scratch. Say yes and reach the breaking point:
(gdb) run

The program being debugged has been started already.

Start it from the beginning? (y or n) y

Starting program: ./crash

enter a number:

10

Breakpoint 1, printSum() at crash.c:22

22     sprintf(buf, "sum=%d", sum_to_n(atoi(line)));
With the program stopped there, we can inspect variables with the command print (o p):
(gdb) print line

$1 = "10\000\000\000\000\000\000…"
The string we read seems reasonable. Now we look at the pointer. buf:
(gdb) print buf

$2 = 0x0
There's the bug: we're moving to sprintf a null pointer as a destination, that is, trying to write to an invalid address. The solution is to reserve memory for buf or use a local array instead of an uninitialized pointer.
GDB also allows execute line by line thanks to the commands Next (n), step (s) and until (u):
- next(n): executes the next line, but if there is a function call, it executes it immediately without entering it.
- step(s): executes the line and, if there is a function called, enters its first instruction, ideal for following your own functions.
- until (u): very useful within a loop; continues execution until it exits that loop and reaches the indicated line or the next one outside the loop.
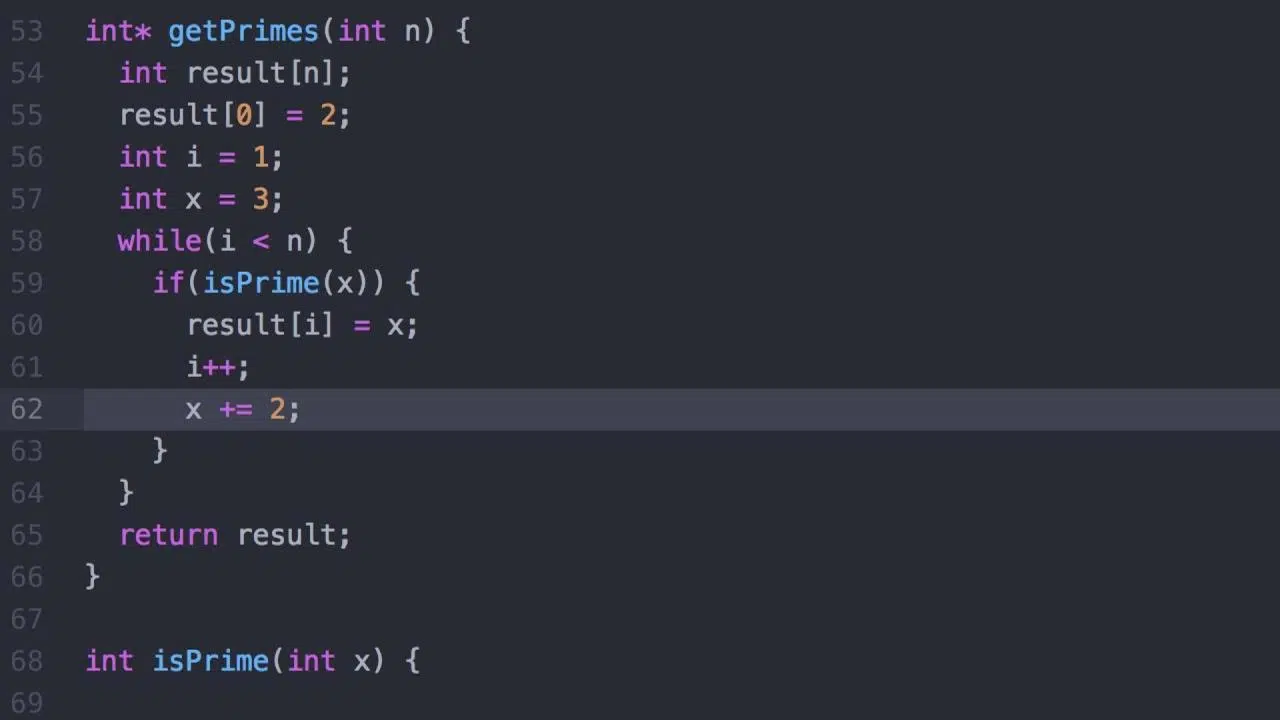
For example, if you put a breakpoint on the loop line of sum_to_n and then you use n o uYou can see how the accumulator evolves without having to manually iterate through all the turns:
(gdb) break crash.c:10

(gdb) run

Breakpoint 1, sum_to_n (num=50) at crash.c:10

10  for (i = 1; i <= num; i++)

(gdb) n

11  sum += i;

(gdb) n

10  for (i = 1; i <= num; i++)

(gdb) until 12

12  return sum;
When you want the program to keep running until the next breakpoint or until it finishes, you use keep on going (o c):
(gdb) continue

Continuing.
Conditional breakpoints and breakpoint management
In programs with large loops or many iterations, you don't always want to stop "in the same place." That's where loops come in. conditional breakpoints, which are only activated if a logical expression is met.
Suppose you want to stop inside sum_to_n only when the parameter num Let it be 50. First, you create the breakpoint on the desired line and then add the condition:
(gdb) break crash.c:10

Breakpoint 1 at 0x8048441: file crash.c, line 10.

(gdb) condition 1 num == 50
After relaunching the program, GDB will only stop when num vale 50 upon reaching that line:
(gdb) run

Starting program: ./crash

enter a number:

50

Breakpoint 1, sum_to_n (num=50) at crash.c:10

10  for (i = 1; i <= num; i++)
To check active break points and their numbers, you can use info breakpointsBreakpoints can be manipulated with various commands:
- delete: without arguments, deletes all breakpoints; with a number, deletes only the specified one (
delete 1). - clear: removes the breakpoint associated with a function or line (
clear main,clear 42...). - disable / enable: allow you to temporarily disable a breakpoint and reactivate it later.
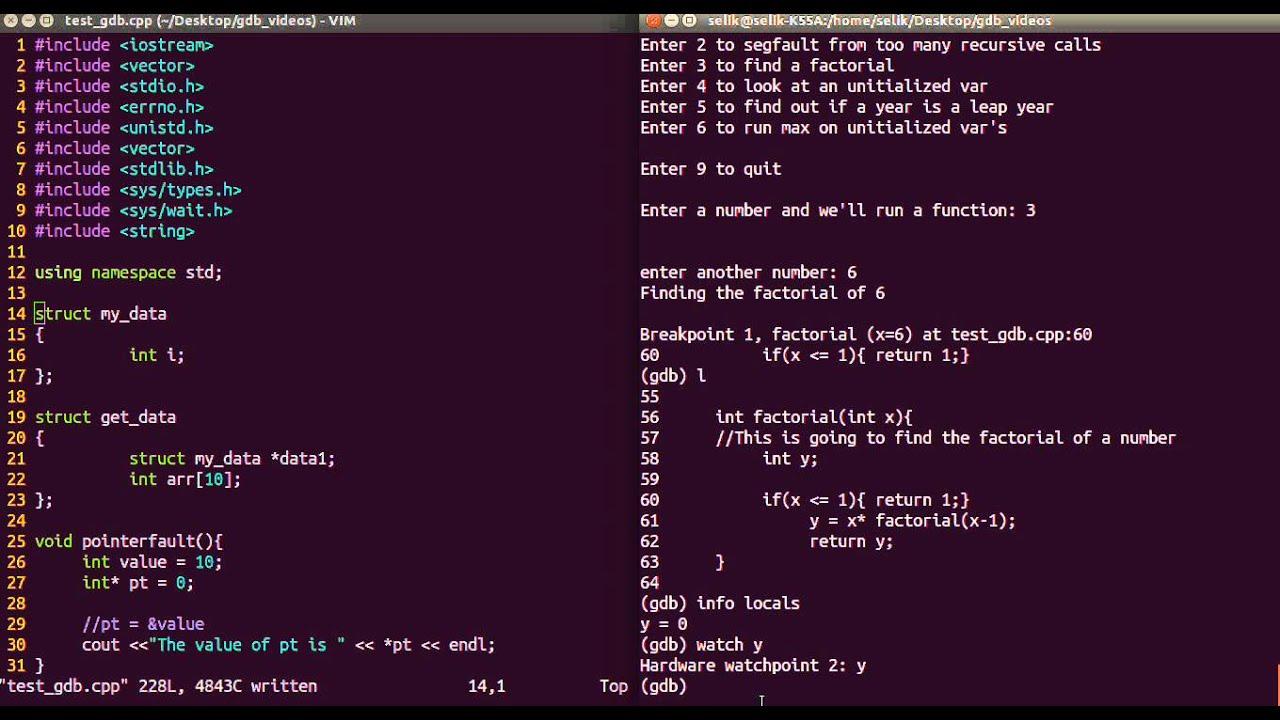
In addition to classic breakpoints, there are also watchpoints, which do not stop at a specific line but when they modifies or reads the content of a variable. They are created with watch variable (for changes) or rwatch variable (for readings), and are listed with info watchThey are very useful for tracking down unexpected writings on a complicated structure.
Explore code, variables, and memory
With the program stopped, you'll mostly be navigating the code and looking at values. GDB offers a fairly convenient collection of commands for that, starting with list, which displays fragments of the source on the screen.
The most common use of list It's requesting a few lines around a line number or function:
list 20: shows some lines centered on line 20.list main: starts listing from the beginning ofmain.listSimply put: it continues listing from the last line shown.
To inspect values, we have already seen that print It's the star command, but it's not limited to simple variables. You can evaluate complete expressions, perform casts, access structure fields, or view array elements:
(gdb) print intermedio

$1 = 134513691

(gdb) print primero

$2 = 2654196

(gdb) print lista@25
In the example of a program with uninitialized variables, GDB allows you to quickly verify that No initial value has been assigned to a local variable and that its contents are garbage. This explains why each execution prints a different number, which is typical when you rely on uninitialized automatic memory.
If you need to view the raw memory contents in one direction, you can combine print &variable to get an address and then use the command x (examine):
(gdb) print &num

$1 = (int *) 0xbffff580

(gdb) x 0xbffff580

0xbffff580: 0x00000064
Also with ptype You can ask GDB to tell you the type of a variable or expression, which is useful when working with complex structures or templates in C++ and you get confused with the types:
(gdb) ptype saldo_ptr
Another powerful feature is the ability to modify variables on the fly with the command set varFor example, if you want a pointer called saldo_ptr I'll point to saldo during the depuration:
(gdb) set var saldo_ptr = &saldo
From that point on, execution continues with that new value, allowing you to test scenarios without recompiling the program each time.
Fine control of execution and call stack
When you get into large programs, it's not enough to just advance line by line; you need to know Why have you gotten this far? and move between different call contexts. GDB offers several commands to manage the stack and navigate through different frames.
The command Where (o backtrace/bt``` displays the call stack, from the current function back to the entry point. Each frame includes the function, parameters, and file/line. You can navigate up and down these frames with ``. up y down to inspect local variables at different levels:
(gdb) where

#0 funcion_profunda() at modulo.c:120

#1 calcula() at core.c:45

#2 main() at main.c:30
To quickly exit a function Without going step by step to the end, there is the command finish, which executes the rest of the body of the current function and stops execution at the call point, returning you to the previous frame.
If you want debugging to start directly in main Without having to stop first at the libc startup code, there is a very useful shortcut: Start MainThis command starts the program and places a temporary breakpoint right at the beginning of the function. main.
To repeat the last command entered, simply press ENTER on a blank line. This is very convenient when you're linking several next o step in a row
Keyboard shortcuts and history management in GDB
Since GDB is used from the terminal, it takes advantage of GNU Readline's line editing capabilities. That means you can use a good repertoire of keyboard shortcuts to move around, edit commands, and reuse previous commands without having to type everything by hand.
Among the most useful shortcuts are:
- CTRL+P / CTRL+N: navigate backward or forward in the command history.
- CTRL+A / CTRL+E: jump to the beginning or end of the current line.
- CTRL+B / CTRL+F: move one character to the left or right.
- ALT+F / ALT+B: move word by word forwards or backwards.
- CTRL + K: cut from the current cursor position to the end of the line, saving it in a buffer.
- CTRL + Y: paste the last cut item at the cursor position.
- CTRL+_ o CTRL+X CTRL+U: undo the last edit of the line (you can repeat this several times).
- CTRL + L: Refresh the screen if the output has become a mess.
- CTRL + C: interrupt the execution of the program you are debugging.
- CTRL+XA: to activate or deactivate a split source code view in the terminal.
- CTRL+X 2: open a second “window” (for example, with assembler) and alternate between views.
One habit that is quickly acquired is to rely heavily on the history with CTRL+P and ENTER when you repeat commands like run, next o print, and use CTRL + R (reverse search, inherited from Readline) to find a command you executed a while ago.
Other useful GDB commands for everyday use
Aside from what has already been mentioned, there are a handful of commands that, even if you don't use them every minute, are worth keeping in mind because They resolve very specific situations in an elegant way.
- help: displays built-in help;
helpIt only teaches general topics, andhelp comandoGo into the details of each order. - info with subcommands: for example,
info functionsto list program functions,info localsto view local variables of the current frame, orinfo breakpointsto check all the breaking points. - run With arguments: Just like in the normal console, you can pass parameters and redirects:
run 2048 24 4orun >salida.txt. - clear: removes the breakpoint located in a specific function or line without needing to remember its internal number.
- keep on going: resumes execution until the next breakpoint or the end of the program.
- quit: The GDB session ends; if the program is still running, it will ask for confirmation.
With this collection of commands and shortcuts you can tackle virtually any typical debugging session in C or C++: compiling with symbols, starting GDB, stop where desired, examine the program's state, alter variables If necessary, continue until you find the source of the problem.
Once you get used to using GDB to follow execution step by step, check the stack after a SIGSEGV, monitor variables with watchpoints, and skip entire loops with untilDebugging ceases to be a process of guessing and testing and becomes a much more precise and controlled investigation, which also improves your understanding of the code itself.
Passionate writer about the world of bytes and technology in general. I love sharing my knowledge through writing, and that's what I'll do on this blog, show you all the most interesting things about gadgets, software, hardware, tech trends, and more. My goal is to help you navigate the digital world in a simple and entertaining way.