- Windows Error Reporting allows you to collect and send error reports and dumps to Microsoft or store them locally for analysis.
- WER configuration is primarily controlled through group policies, telemetry settings, and specific registry keys.
- It is possible to limit the type of data and dumps sent, as well as manage the space occupied by HDMP and MDMP files.
- Tools like PowerShellProcDump, WinDbg, and TSS facilitate activation, diagnostics, and advanced debugging of errors in Windows.
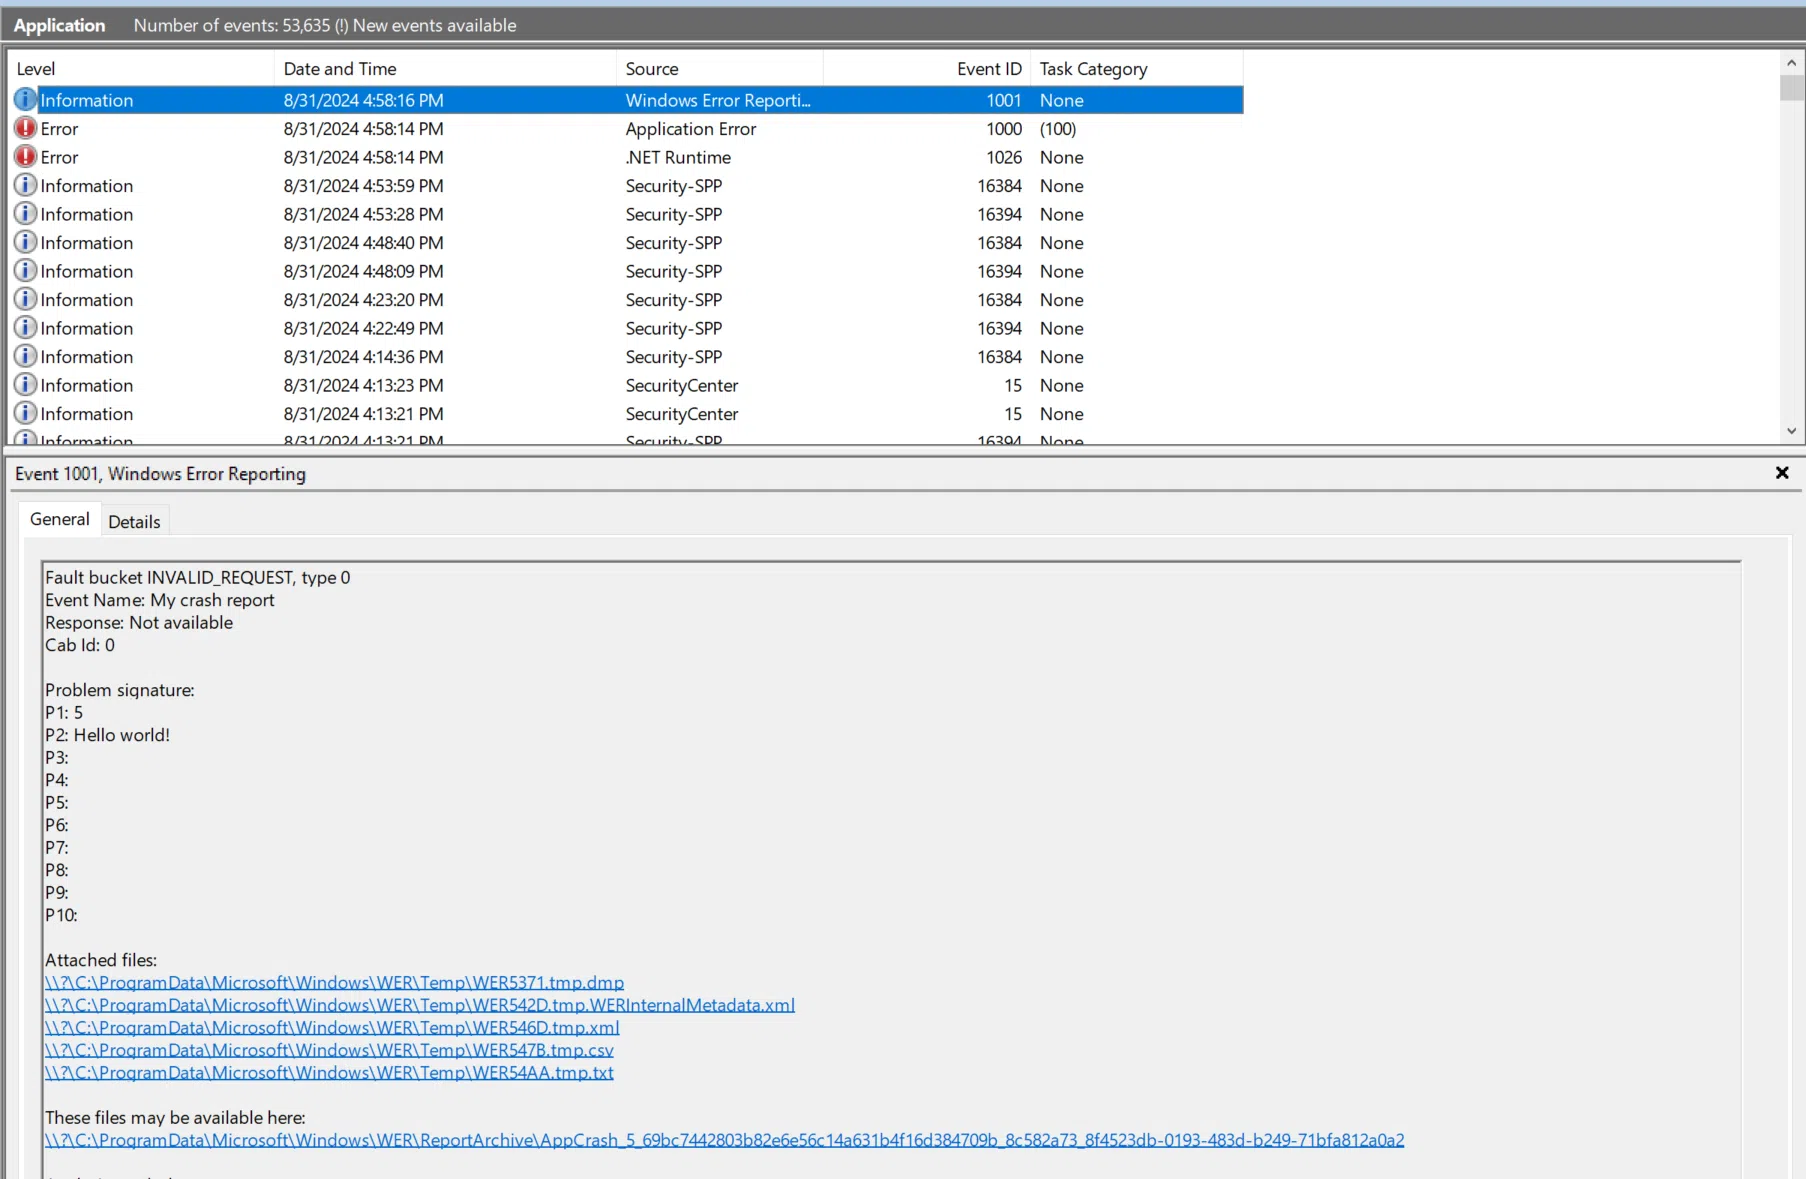
If you manage Windows systems on a daily basis, sooner or later you'll have to deal with Windows Error Reporting (WER) . Sometimes it's an indispensable tool for diagnosing crashes and unusual errors, and other times it becomes a disk space hog or a constant source of events when the server has no internet access.
This guide shows you how to enable, disable, and fine-tune WER in different versions of Windows, how to control memory dumps (HDMP/MDMP), which network addresses it uses, how to validate it via the Registry, and even how to manage it with PowerShell and batch scripts. Everything is explained in Spanish (Spain), with practical examples and no details left out.
What is Windows Error Reporting (WER) and what is it used for?
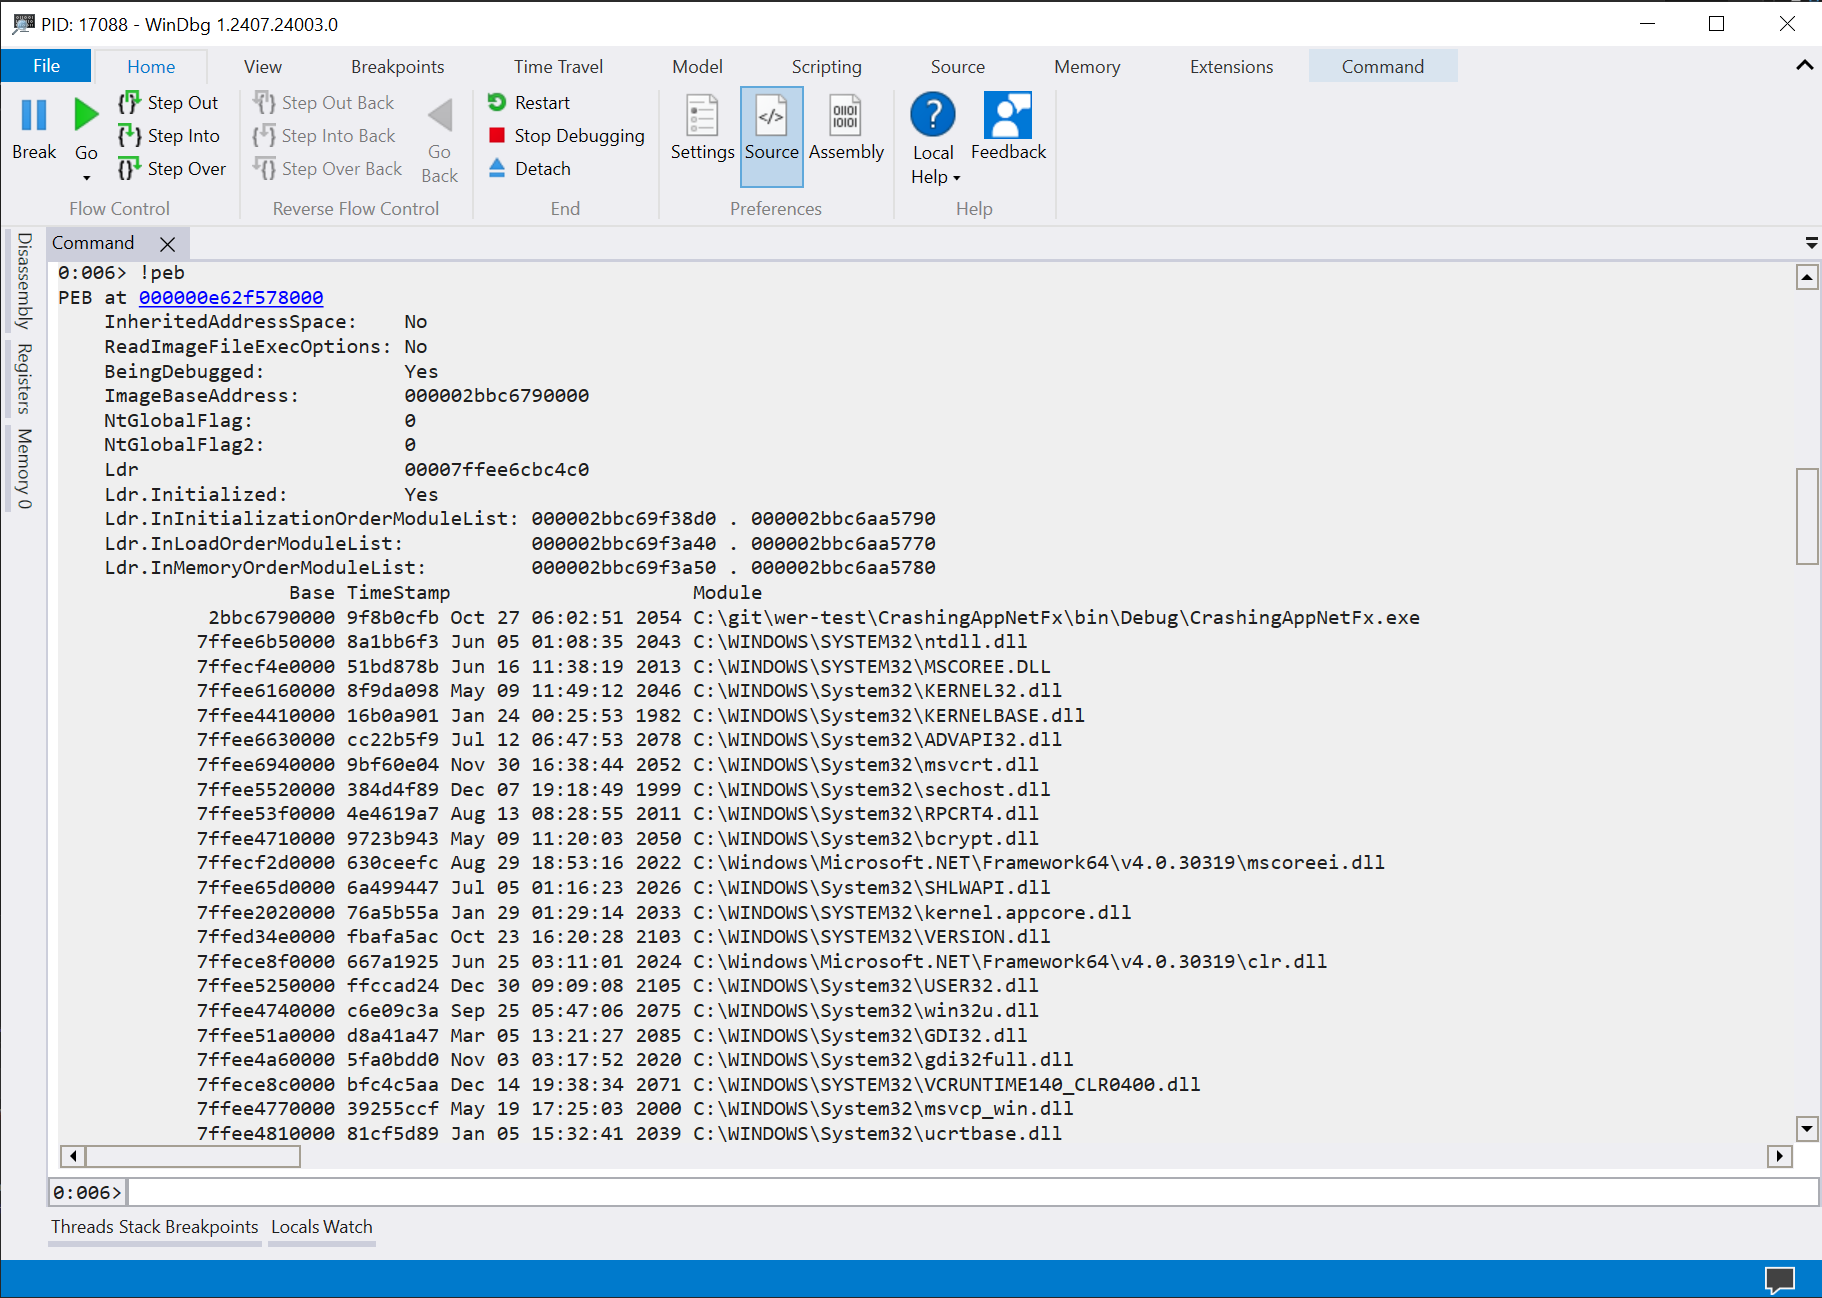
WER is a built-in Windows error collection and reporting platform that is triggered when an application crashes, the browser becomes unresponsive, a service fails, or serious system errors occur (such as kernel crashes). Sometimes these failures are related to untested applications that require specific diagnostic steps.
When this occurs, the system can generate reports and memory dumps containing information about the process, loaded modules, memory usage, and other technical data. This information can be sent to Microsoft to try to find known solutions or for the product team to improve the affected system and applications.
In addition to online reports, WER can be configured to save user-mode memory dumps locally , which is very useful when you need to analyze critical application crashes, servers without internet access, or environments where data privacy is key.
In many organizations, the decision to enable WER, restrict it, or disable it completely is based on security policy, internet access, or the volume of errors generated on servers.
Enable Windows Error Reporting (WER) using group policies
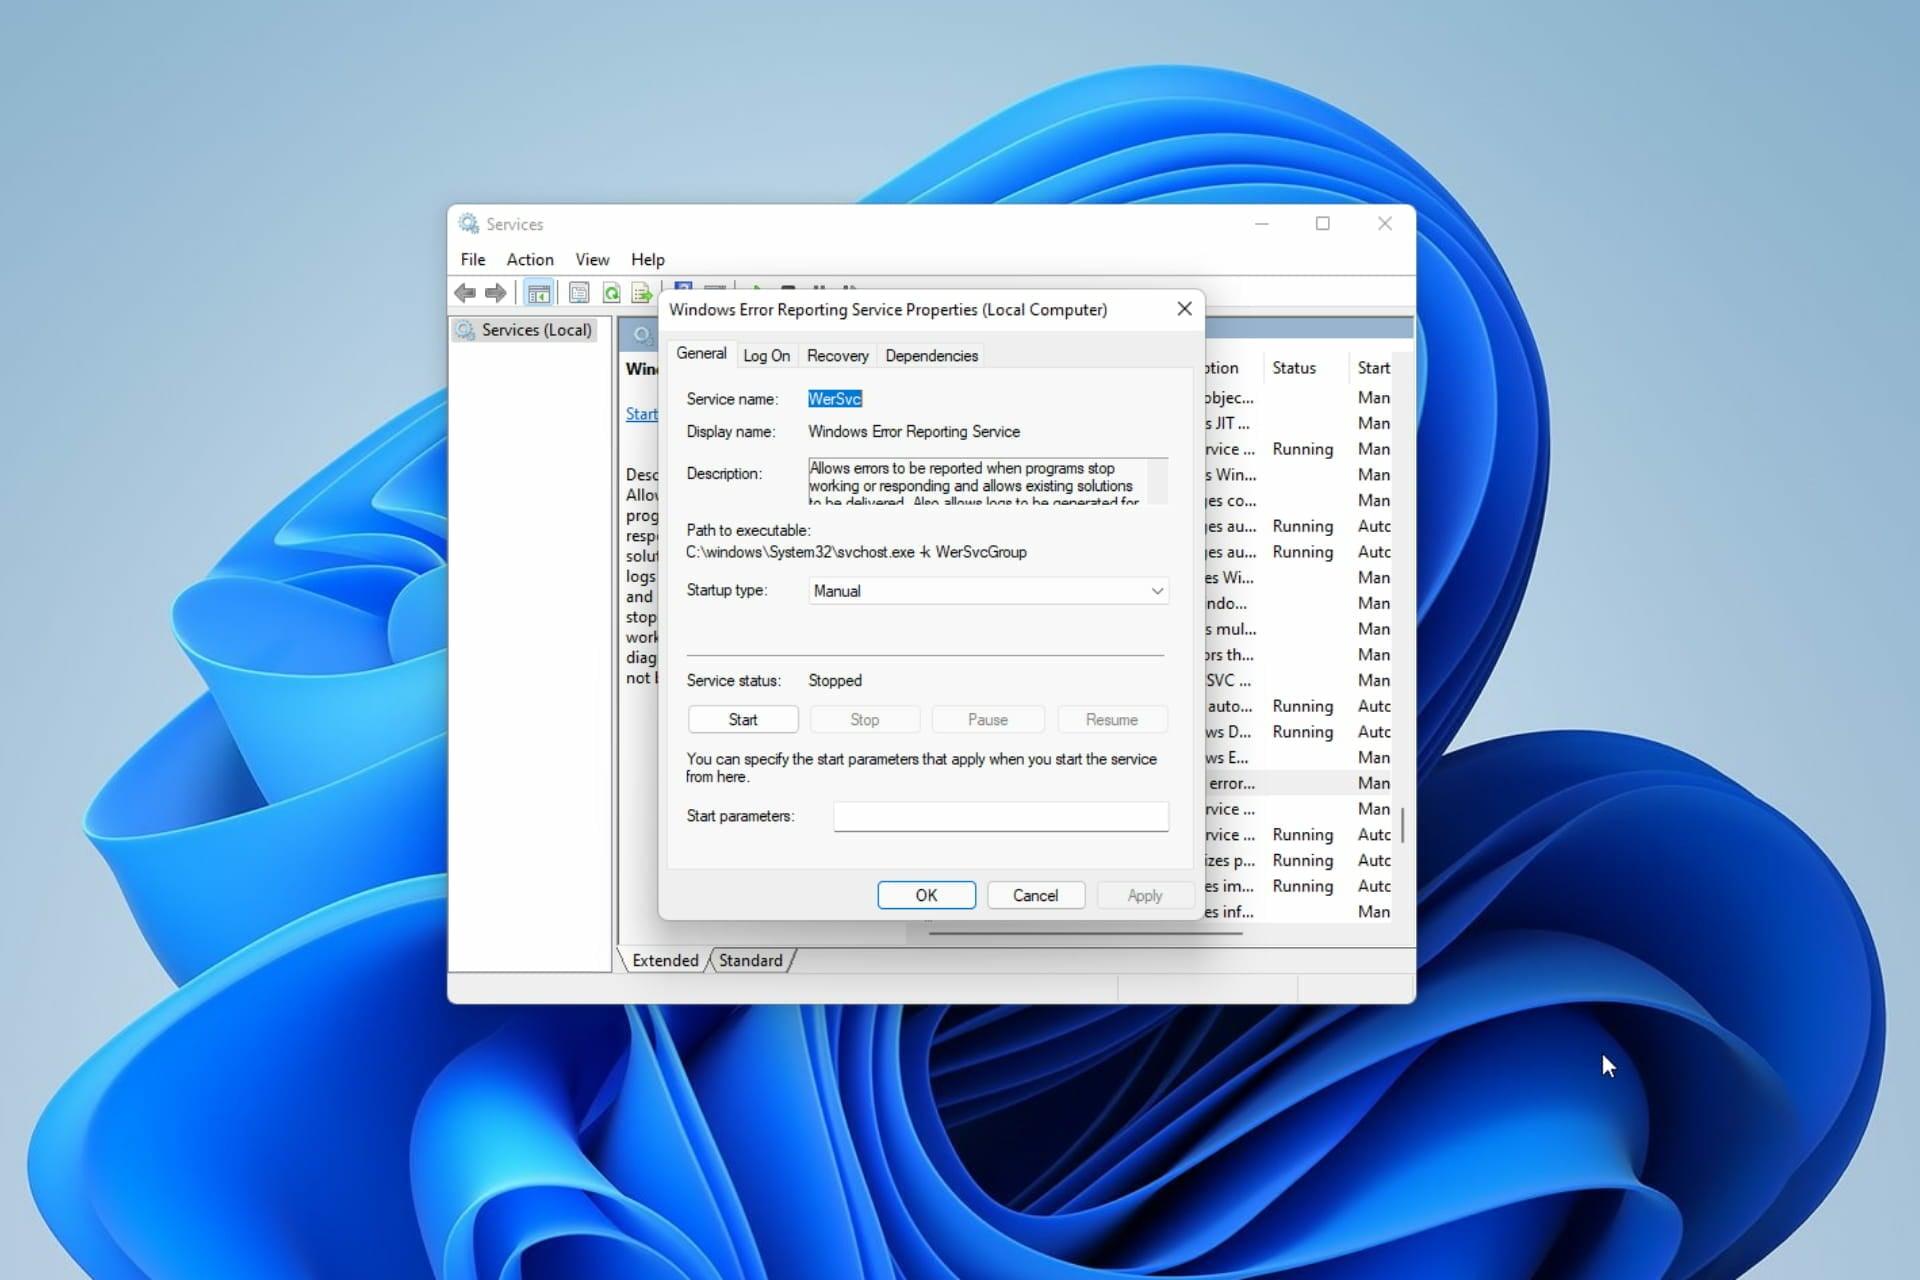
In domain environments, the most convenient way to control WER is through GPO to ensure consistent settings across all computers. From the Group Policy Management Editor ( gpmc.msc ), you can enable or disable WER and adjust what is sent.
First, ensure there are no policies blocking it. To do this, navigate to the appropriate path in the computer's settings and review the policies related to disabling error reporting.
In the policy tree, navigate to Computer Configuration > Administrative Templates > System > Internet Communications Management > Internet Communications Settings . Within this section, you will find the policy regarding disabling Windows error reporting.
Open the policy called "Disable Windows Error Reporting" and select the "Disabled" option. This indicates that you do not want WER to be blocked at the communications level. Apply the changes by clicking "Apply" and "OK".
Next, in the same Policy Editor, go to Computer Configuration > Administrative Templates > Windows Components > Windows Error Reporting . There you will find the Disable Windows Error Reporting policy , which directly controls whether the service is running.
Open that policy and reselect the "Disabled" option to formally enable WER on the system . Again, confirm with "Apply" and "OK" to replicate the configuration to the computers in the OU to which the GPO is linked.
Configure the diagnostic data level in Windows
WER's behavior is closely tied to the Windows diagnostic and telemetry data configuration . Depending on the configured level, it can send anything from minimal data to more detailed information, including dumps and logs.
To adjust this behavior, the data collection branches and preview versions in group policies are used again , with slight differences between Windows 11 and Windows 10.
Configure diagnostic data in Windows 11
On computers running Windows 11, open the Group Policy Editor and go to Computer Configuration > Administrative Templates > Windows Components > Data Collection and Previews . Here you'll find several options to control what type of information is collected and sent.
Locate the Allow Diagnostic Data policy and open it. Select the “Enabled” option, and in the Options dropdown, select Send optional diagnostic data . This level allows WER and other components to collect more technical details, which is very useful in advanced troubleshooting and support environments.
Confirm with “Apply” and “OK,” and then locate the policy Configure diagnostic data user interface settings . This policy determines what the end user sees in the privacy interface.
Activate this policy by setting it to "Enabled" and then select " Disable diagnostic data sharing settings " from the dropdown menu . This will prevent users from independently modifying the diagnostic level you have defined at the corporate level. Reapply and accept the changes to finalize the policy.
Configure diagnostic data in Windows 10
In Windows 10, the configuration path is similar. You need to go to Computer Configuration > Administrative Templates > Windows Components > Data Collection and Previews . Within that section, you'll find a key policy called Allow Telemetry.
Open the "Allow telemetry" policy and set its status to " Enabled ". The Options dialog box offers a list of levels that varies slightly depending on the version of Windows 10 installed.
For systems running Windows 10 version 1903 or later , the most granular level is "Optional." However, for Windows 10 versions 1809 and earlier , the maximum level is "Full." Choose the appropriate option based on the system build you are managing.
Save the changes with "Apply" and "OK". From here, and especially for versions 1803 and higher, you can further refine what the user sees in the telemetry interface.
Next, locate the policy " Configure telemetry user interface settings ." Enable it and select the "Disable telemetry participation settings" option from the Options dropdown. This will prevent the user from changing telemetry settings through the Windows graphical settings. Again, click "Apply" and then "OK" to close the policy window.
Network connection points used by WER and diagnostic data
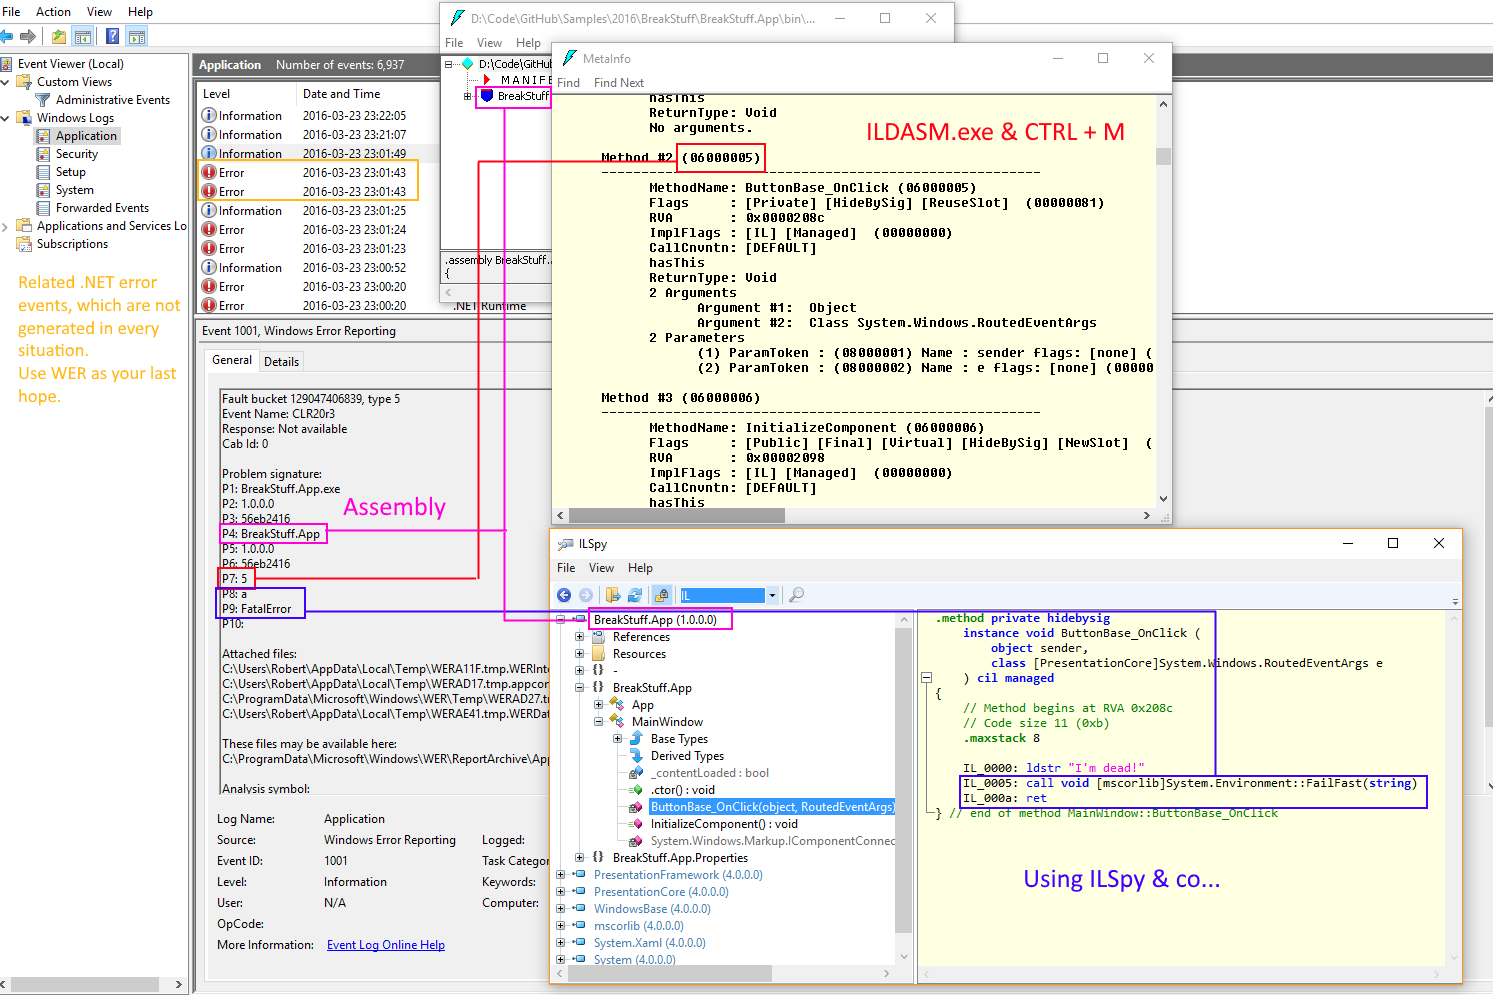
When WER and the diagnostic components are active, Windows can connect to a number of Microsoft endpoints to send reports and dumps. Knowing these addresses is crucial on restricted networks, behind perimeter firewalls, or on servers without internet access.
WER traffic typically uses TCP port 443 with HTTPS encrypted by SSL/TLS and certificate anchoring techniques to ensure it actually connects to Microsoft servers. If this traffic is blocked, you'll see recurring connection attempts and related events in the viewer.
Most common connection points that WER can access:
- watson.microsoft.com for virtually all versions of Windows.
- watson.telemetry.microsoft.com Starting with Windows 10 version 1803.
- Different Azure Blob Storage hosts such as umwatsonc.events.data.microsoft.com or addresses of the type ceuswatcab01.blob.core.windows.net, eaus2watcab01.blob.core.windows.net o weus2watcab02.blob.core.windows.net, used in more modern versions such as Windows 10 1809 and later.
If you need to allow only certain domains in the firewall for WER to function correctly, you must include this list of hostnames. In isolated scenarios (for example, servers without internet access), it's common practice to disable or strictly limit sending to prevent the system from repeatedly connecting to these endpoints.
Limit the type of additional data that is sent to Microsoft
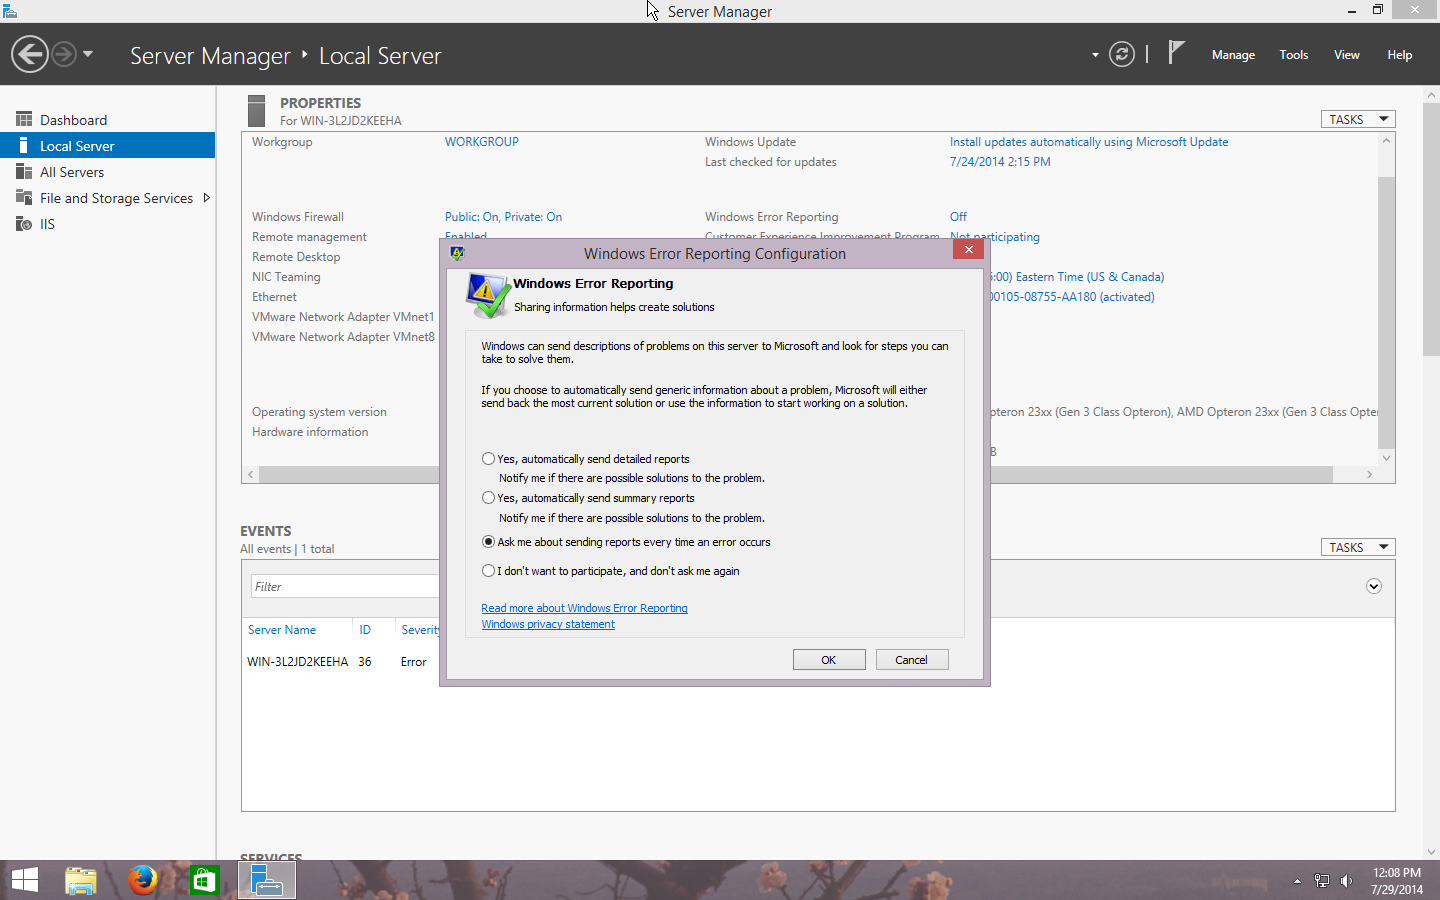
Even if WER is enabled and diagnostic data is allowed in optional mode, you may want to control what type of memory dumps are shared with Microsoft for confidentiality or regulatory compliance reasons.
The policies described in the previous sections can cause WER to only send kernel minidumps and lightweight user-mode dumps . However, if you have opted for the optional data level, you can further tighten these limits using additional directives.
In Windows 11 and Windows 10 version 1909 and later, go back to Computer Configuration > Administrative Templates > Windows Components > Data Collection and Previews . In that section, you'll find specific policies to limit the types of dumps.
Open the Limit Memory Dump Collection policy and set it to "Enabled". This will ensure that only dumps permitted by the policy are collected , preventing excessively large or sensitive data from being captured. Apply and accept the settings.
Next, locate the " Limit diagnostic log collection " policy . Enable it to restrict the volume and type of logs included in the associated telemetry. After selecting "Enabled," click "Apply" and "OK" to save the changes.
Verify the correct configuration using the Registry
Once you've deployed the GPOs that control WER and diagnostic data, it's recommended to verify on a test machine that the registry keys have been applied as expected. You can do this by using regedit.exe on a computer affected by the policy.
First, check the key HKEY_LOCAL_MACHINE\SOFTWARE\Policies\Microsoft\Windows\DataCollectionThis should reflect the values you have defined for telemetry and collection restrictions.
Some typical values that usually appear in this key are:
| Registry Key Name | Expected data |
|---|---|
AllowTelemetry |
0 x 00000003 for optional/full level |
DisableTelemetryOptInSettingsUx |
0 x 00000001 to block user changes |
LimitDiagnosticLogCollection |
0 x 00000001 if you have limited diagnostic logs |
LimitDumpCollection |
0 x 00000001 when you restrict memory dumps |
Then check the key HKEY_LOCAL_MACHINE\SOFTWARE\Policies\Microsoft\PCHealth\ErrorReportingThere is usually a value here. DoReport configured to 0 x 00000001This indicates that error reporting is permitted according to corporate policy.
Another key point is HKEY_LOCAL_MACHINE\SOFTWARE\Policies\Microsoft\Windows\Windows Error ReportingIn this location, you'll be particularly interested in the values Disabled y DontSendAdditionalData, which determine whether WER is turned off or whether it can send additional data.
| Registry Key Name | Expected data |
|---|---|
Disabled |
0 x 00000000 to keep WER enabled |
DontSendAdditionalData |
0 x 00000001 to block the sending of extra data |
Finally, on the route HKEY_LOCAL_MACHINE\SOFTWARE\Microsoft\Windows\Windows Error Reporting\Consent There is an important value called DefaultConsentWith a data set as 0 x 00000004The system adjusts the default behavior regarding consent for sending reports.
Activate and deactivate WER using PowerShell commands
In addition to GPOs and the Registry, Windows includes specific cmdlets for handling WER from PowerShell, which is very convenient when you want to operate on isolated servers or automate tasks in scripts.
The main cmdlet to enable this functionality is Enable-WindowsErrorReporting . With no additional parameters, its syntax is very simple:
Enable-WindowsErrorReportingRunning this command in an elevated PowerShell console activates Windows Error Reporting on that computer . Internally, it adjusts the necessary settings so that error reports are regenerated and sent according to the defined telemetry configuration.
This cmdlet returns a result of type BooleanIf the operation is completed successfully, the return value will be $TrueOtherwise, you will get $FalseThis allows you to integrate a simple check into your deployment or maintenance scripts.
Example of direct use :
PS C:\> Enable-WindowsErrorReportingTo check the current status of WER, you can use the Get-WindowsErrorReporting cmdlet , which will tell you whether it's enabled or not. And if you want to disable it later, you can use the Disable-WindowsErrorReporting cmdlet , which turns off the feature and prevents further error reports from being sent to Microsoft from that computer.
Activate or deactivate WER using remote PowerShell and Batch scripts
In remote management solutions such as certain MDM or EMM platforms, it is common to allow custom scripts to enable or disable WER in bulk. These typically involve modifying registry keys or invoking the cmdlets described in the previous sections.
A PowerShell script can, for example, read the current status of the error reporting service and write to the action history whether it is "Enabled" or "Disabled" after execution. When the script runs successfully, the management console typically displays "True" as the result to indicate that the operation was successful.
In the case of batch scripts, the logic is usually similar but directly editing the key HKLM\SOFTWARE\Microsoft\Windows\Windows Error ReportingA typical command to enable WER will consist of creating or modifying the value Disabled assigning the data 0thus allowing the system to collect and send reports.
Similarly, to disable WER using a .bat file, the Disabled value is changed to 1 , blocking the collection and transmission of errors to Microsoft servers. If everything goes well, these actions usually log the message "The operation completed successfully" in the remote tool's history.
Event Viewer population and servers without internet access
In some environments, especially on isolated servers or those without external connectivity , WER can end up filling the Event Viewer with repetitive messages indicating failed connection attempts or report submissions.
This behavior is due to the service attempting to contact the Microsoft endpoints described above, but since the outbound connection is blocked, it periodically retries , generating more events and, occasionally, some noise in the event log.
For these situations, you can disable WER at the policy level, use registry keys to mark it as disabled, or restrict additional data from being sent by combining values such as Disabled and DontSendAdditionalData . Another option is to keep the report active but only for local dumps , without outbound telemetry.
HDMP and MDMP file management and disk space consumption
Something that often goes unnoticed is the disk space that HDMP and MDMP files generated by WER can occupy when many errors occur in a short time, for example on an application server like SharePoint.
HDMP files typically contain a complete dump with a lot of process information, while MDMP (minidump) files are compressed dumps with a subset of data. Both are stored in different locations depending on the Windows version, and can cause the system disk to nearly crash if not managed properly.
On older systems like Windows Server 2003 or Windows XP , dumps are often saved in the C:\WINDOWS\pchealth\ERRORREP\UserDumps folder . On more recent versions like Windows 7 or Windows Server 2008, reports are typically saved to directories such as:
- C:\ProgramData\Microsoft\Windows\WER\ReportArchive
- C:\ProgramData\Microsoft\Windows\WER\ReportQueue
- C:\Users\UserName\AppData\Local\Microsoft\Windows\WER\ReportArchive
- C:\Users\UserName\AppData\Local\Microsoft\Windows\WER\ReportQueue
In these directories, you'll find files with names like w3wp.exe{date}.mdmp or w3wp.exe{date}.hdmp , associated with the failed process (for example, the IIS worker process on SharePoint servers). If the dumps are caused by library failures, you can consult guides for resolving related DirectX and DLL errors.
If you notice that these dumps are growing uncontrollably, you can temporarily disable WER , clean up the folders, or properly configure the dump collection limits (DumpCount, DumpType, etc.) so that the system self-regulates and doesn't leave the disk without free space.
Disable WER in older versions of Windows (XP/2003)
In systems like Windows 2003 or Windows XP , error reporting was partly managed through the system properties panel. It was possible to disable reporting globally or enable it only for specific applications.
The typical procedure involved right-clicking on "My Computer," going to "Properties," entering the "Advanced" tab, and clicking on the "Error Reporting" option. From there, you could completely disable the report or configure which programs should and should not report.
Although these versions are now unsupported, many legacy environments are still present, so knowing that WER can be managed from that interface and from folder paths like UserDumps is still useful for cleaning and maintenance tasks.
Configuring WER via Registry in Windows 7, Windows 8, and Windows Server 2008
In more modern versions such as Windows 7 and Windows Server 2008In addition to the graphical options, you can control WER from the Registry EditorThe base key is HKEY_LOCAL_MACHINE\SOFTWARE\Microsoft\Windows\Windows Error Reporting.
To completely disable error reporting, you typically create or modify the DWORD value " Disabled " and set it to 1. This stops the service from generating and sending reports . To reactivate it, simply set the value to 0 or delete the entry.
Regarding the graphical interface, the system also allowed certain adjustments from "System Properties" > "Advanced" > "Performance" > "Settings," and, for example, reviewing options related to Data Execution Prevention (DEP) . While not exactly the same as Windows Error Response (WER), it relates to how Windows protects against and reacts to certain failures.
Enable detailed logging of application crashes (example with explorer.exe)
Sometimes, to diagnose why a particular application is crashing, it's helpful to force the generation of detailed local dumps . A classic example is the explorer.exe process , which, when it freezes, leaves the user with a frozen desktop; as an alternative to mitigate the impact, you can restart File Explorer while preparing the snapshot.
This can be achieved by creating a .reg file that adds several keys to the Registry. For example, under HKEY_LOCAL_MACHINE\SOFTWARE\Microsoft\Windows\Windows Error Reporting\LocalDumps\Explorer.exe Parameters can be defined such as DumpFolder (for example, “C:\\WER Dumps”) and DumpType with a value 2 to indicate a complete dump.
Additionally, in HKEY_LOCAL_MACHINE\SOFTWARE\Microsoft\Windows NT\CurrentVersion\Image File Execution Options\explorer.exe Values can be configured such as Global Flag y PageHeapFlags to activate advanced debugging techniques that force WER to generate comprehensive information in case of a crash.
After importing that .reg file and once the incident has occurred, the error reporting service will create dumps in the configured folder , for example C:\WER Dumps , which can later be reviewed with dump analysis tools such as WinDbg or simpler utilities.
Configure full user-mode dumps with WER (LocalDumps)
Starting with Windows Server 2008 and Windows Vista SP1, Windows Server (WER) was able to save complete local user-mode dumps when an application crashes. This feature is not enabled by default and requires administrator privileges to configure.
The configuration is done in the key HKEY_LOCAL_MACHINE\SOFTWARE\Microsoft\Windows\Windows Error Reporting\LocalDumpsHere you can define various values that control where the dumps are stored, how many are saved, and what type they are.
The most important Registry values are:
| Price | Description | Type | Default value |
|---|---|---|---|
| DumpFolder | Path where the dumps are saved. If this is changed, make sure the folder has proper permissions so that the blocked process can write there. | REG_EXPAND_SZ | %LOCALAPPDATA%\CrashDumps |
| DumpCount | Maximum number of dump files stored in the folder. When this limit is exceeded, the oldest dump is overwritten for a new one. | REG_DWORD | 10 |
| DumpType | Indicates the dump type: 0 (custom), 1 (minidump), or 2 (full). The value determines how much information is included in the File. | REG_DWORD | 1 |
| CustomDumpFlags | It is used only if DumpType is 0. It is a bitwise combination of values of MINIDUMP_TYPE to adjust which specific data is captured in the custom dump. | REG_DWORD | Usually 0x00000121 (which combines several flags such as MiniDumpWithDataSegs, MiniDumpWithUnloadedModules and MiniDumpWithProcessThreadData). |
These parameters are considered a global configurationIf you want to fine-tune the behavior for a specific application, you can create a subkey with the exact name of the executable within LocalDumps, for example LocalDumps\MiAplicacion.exeand define your own values for DumpFolder, DumpCount, etc.
When an application crashes, the system first checks the global configuration and then applies any application-specific settings, if any. Once the crash dump is generated, the application can either close normally or attempt to recover if it is prepared to do so.
An interesting detail is that these local dumps are managed independently of the rest of the WER infrastructure. You can have local collection active even if WER is disabled at the report sending level or even if the user has canceled the report.
Tools and improvements for working with dumps in Windows 11
In more recent versions such as Windows 11, improvements have been added that facilitate the creation and analysis of dumps, both from the graphical interface and from specialized tools.
Task Manager includes an option to generate an active memory dump of any user-mode process or even kernel processes. Simply go to the "Processes" or "Details" tab, right-click on the process, and choose "Create active memory dump file."
The Sysinternals ProcDump utility has also been enhanced , now supporting more triggers, such as thread creation and termination, certain performance counters, and the detection of frozen windows. In Windows 11, ProcDump is capable of working with all types of triggers introduced from Windows 8.1 onward.
In the area of debugging, tools like WinDbg and CDB allow you to analyze both minidumps and full dumps. They have been updated to better handle user-mode dumps, even being able to read dumps directly from CAB files or analyze multiple dump files at once—very useful when you have recurring issues. You can also diagnose errors with Dependency Walker to complement the analysis.
Using TSS to collect performance and network traces
In advanced support scenarios, Microsoft sometimes recommends using scripts such as TSS.ps1 to gather detailed information about the system, including performance data, configuration, and network traces associated with WER and other components.
The typical workflow involves downloading TSS on all affected nodes and extracting it to a standard folder such as C:\tss . Then, a PowerShell window is opened with administrator privileges in that same location.
From there, it is possible to launch different collection scenarios using commands such as:
TSS.ps1 -SDP PERF,SETUP
TSS.ps1 -Scenario NET_WFP
When you run them, the script will ask you to accept the license terms (EULA), and once you give your consent, it will automatically begin collecting the necessary data . This may take some time depending on the amount of information and the system load.
At completion, the results are usually compressed into a ZIP file within a folder like C:\MS_DATA\SDP_PERFSETUP\ , which you can upload to a Microsoft support workspace for analysis by engineers.
Mastering Windows Error Reporting means understanding how group policies, telemetry, the Registry, local dumps, and analysis tools interact . By properly configuring these elements, you can ensure your systems report only what's necessary, prevent servers from running out of space due to HDMP/MDMP issues, avoid constant connection attempts on restricted networks, and simultaneously provide the essential information needed to diagnose and resolve crashes and critical failures as they occur.


Passionate writer about the world of bytes and technology in general. I love sharing my knowledge through writing, and that's what I'll do on this blog, show you all the most interesting things about gadgets, software, hardware, tech trends, and more. My goal is to help you navigate the digital world in a simple and entertaining way.