- Forecast functions in Excel allow you to anticipate future results using historical data.
- You can choose between different methods depending on the seasonality and relationship of your data.
- Customizing parameters and analyzing forecast quality ensures more reliable forecasts.
Learning how to predict results in Excel can make a difference when making strategic decisions in companies of any size. Data analysis and the ability to anticipate future trends or needs are essential, and Excel offers various specialized functions to make these forecasts simple and effective.
The FORECAST function in Excel and its variants allow you to project future values. using historical data, which is especially useful for forecasting sales, managing inventories, or anticipating different consumer behaviors. If you've ever wondered how to get the most out of your data in Excel, this article is just what you need to master forecasting functions and apply them with ease in your spreadsheets.
What does it mean to make a forecast in Excel?
The term forecast In Excel, it translates as "forecast" and refers to the estimation of future values based on past information. In a business context, this is often used to forecast sales, calculate inventory needs, schedule production, or analyze market trends. The sales forecast, for example, allows you to anticipate how much will be sold in a given period., key data for making decisions that directly affect the economic success of any business.
Generally, the forecast is carried out periodically (monthly, weekly, or yearly). Reliable and organized historical data is essential for accurate forecasts, as all of this mathematical machinery is based on statistics applied to your records.
Types of forecasts applicable in Excel
There is no single forecasting technique; depending on the information available and the desired accuracy, Excel allows you to apply different forecast models:
- Qualitative forecast: It is used when there is insufficient historical information. Companies can use surveys, expert opinions, or market analysis to obtain estimates.
- Forecast based on time series: Analyze the company's historical data using techniques such as moving averages, exponential smoothing, or advanced models such as Box-Jenkins.
- Forecast based on causal models: Uses specific variables that affect the magnitude we want to predict, such as linear regressions that relate two or more key factors.
Main forecasting functions in Excel
Excel includes several functions for automatically creating forecasts, including:
- FORECAST.LINEAR (o FORECAST.LINEAR): Predicts future values using simple linear regression. It is ideal for linear relationships between two data sets (e.g., sales over time).
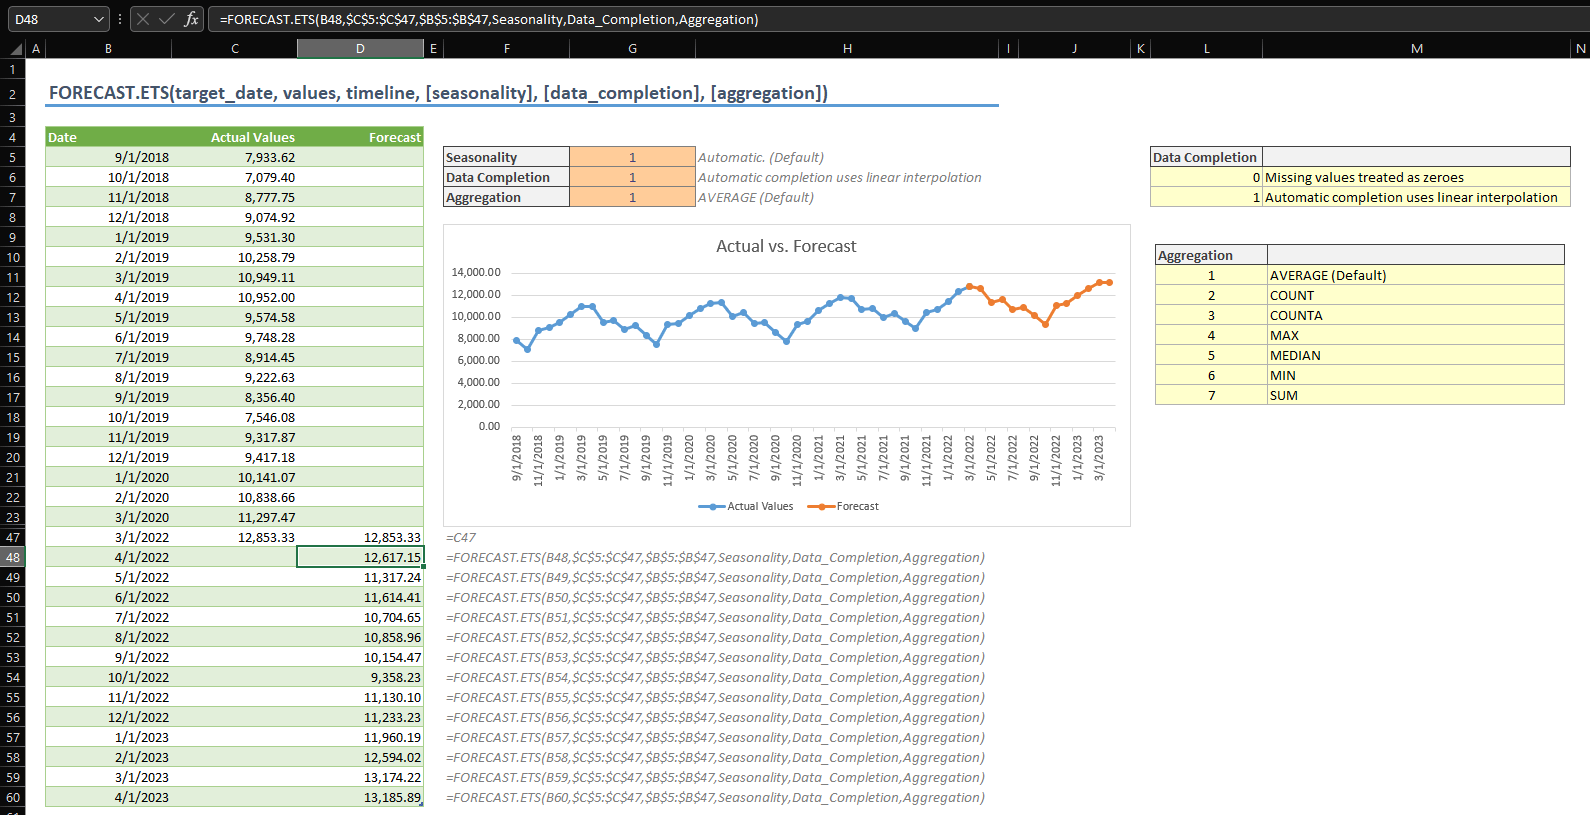
- FORECAST.ETS (o FORECAST.ETS): Makes predictions using the Exponential Triple Smoothing (ETS) algorithm, adapted for data with seasonal patterns or periodic fluctuations.
Both functions allow you to predict future results based on historical data and are a solid option for any user who wants to take their data analysis to the next level without resorting to advanced statistical software.
Syntax and arguments of prediction functions
FORECAST.LINEAR and PRONOSTICO.LINEAL
The syntax is as follows:
FORECAST.LINEAR(x, known_y, known_x)
Here are the key arguments:
- x: The value for which you want to predict the outcome (for example, a future date or index).
- known_and: Range of dependent data or values already recorded (e.g. historical sales).
- known_x: Range of independent data or the influencing variable (e.g., There or unit cost).
All arguments are mandatory. If any of them are empty or have a different number of points, the formula returns an error. In addition, if the variance of the data in known_x is zero, the result will be an error (#DIV/0!).
FORECAST.ETS or PRONOSTICO.ETS
This function is recommended when the data exhibits seasonality. Its syntax is:
FORECAST.ETS(target_date, values, timescale, , , )
- destination_date: Date, time or future point to be predicted.
- values: Historical series of values.
- time scale: Historical dates or indexes; must have regular steps.
- seasonality (optional): Number indicating the pattern's recurrence. If omitted, Excel automatically detects it.
- data_filling (optional): Controls how missing data is handled (0 to treat as zeros, 1 to interpolate).
- aggregation (optional): Method to combine values with the same date (default is average).
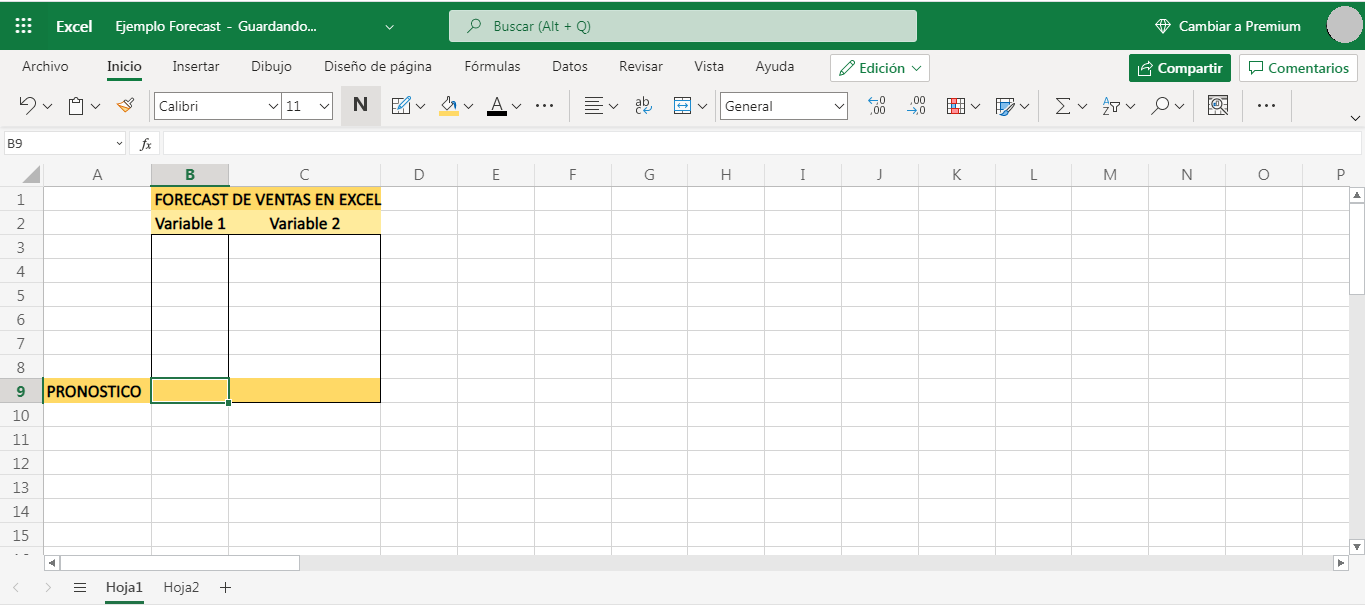
How to create a forecast in Excel step by step
- Prepare your data: Enter two series, one with the time scale (dates or regular indices) and another with the historical values.
- Select both series and go to the tab Facts & figures > Forecast > forecast sheet.
- Configure the chart: Choose the visual type (lines or columns) to display the result.
- Choose the end date for your forecast and click on Create.
- Excel will automatically generate a new sheet with the historical data table, the predicted values, and a chart.
Additionally, from the configuration window you can adjust advanced options such as confidence interval, seasonality, aggregation method, or how to handle missing data.
Customize the forecast: advanced options
Excel goes beyond a simple prediction: it allows you to customize various parameters to adapt the forecast to the specific needs of each case. Some of the most notable options include:
- Start and end of forecast: Choose where to start the estimate and how far you want to project.
- Confidence interval: It shows the range within which 95% of future results are expected to fall. The narrower this range, the more certain you are about your estimate.
- Seasonality: Set the data frequency; if not adjusted correctly, the forecast may not reflect reality.
- Handling missing data: Decides whether missing values are interpolated (neighbor average) or considered zeros. This is crucial for series with small gaps.
- Aggregation of duplicate data: If there are multiple entries with the same date or timestamp, Excel can average, count, sum, or use other methods.
- Inclusion of statistics: You can generate additional tables with metrics such as mean absolute error, smoothing coefficients, or R-squared to assess forecast quality.
Practical Applications: Simple Forecast Example with Excel
Imagine a company wants to know how many units of a product it will sell with a new unit cost. To do this, it has a history of prices and units sold:
| Unit Cost | Sold units |
|---|---|
| 120 | 8.000 |
| 130 | 10.500 |
| 140 | 12.100 |
| 150 | 14.350 |
After analyzing the XY graph (unit cost vs. sales), a linear trend is observed. Using the function FORECAST.LINEAR Or by adding a trend line to the chart, Excel generates a mathematical formula that relates both variables. For example: Sales = 102,4 x (unit cost) – 191,64.
If you want to estimate sales for a unit cost of €150, the formula would be: 102,4 x 150 – 191,64 = 15.168 units.
To validate the robustness of the prediction:
- Look at the graph: If the points are close to the trend line, there is a good correlation.
- use the function CORREL: If the result is close to 1, the relationship found is strong; if it is close to 0, it is weak and the prediction may not be reliable.
In cases of non-linear relationships, Excel also allows exponential or other models to be applied through the Analysis Toolpak add-in.
Advanced Forecasting: Exponential Smoothing and Analysis Toolpak
There are situations where a simple linear relationship is not sufficient, and more sophisticated methods need to be applied, such as exponential smoothingFor example, certain economic processes or growth data often follow these types of patterns. Excel makes this easy by using the Analysis ToolpakTo install it, simply go to Excel Add-ins and activate it; from there, you'll have access to tools like linear regression, smoothing, and analysis of variance.
The data analysis module allows you to obtain:
- Automatic linear and exponential regressions with detailed reports.
- Coefficients of determination (R squared) to determine whether the prediction fits the data correctly.
- Advanced Diagnostics on reliability of the estimates, to detect possible errors or weaknesses in the model used.
All of this helps automate the process of comparing different forecasting methods, allowing you to select the most appropriate one based on the nature of the data.
Additional functions and references in Excel
Excel not only allows you to forecast specific values, but also generates entire spreadsheets with expected results, illustrative graphs, and additional tables, especially using the automatic forecasting options. You can also delve into the formulas used, analyze exponential smoothing (ETS) algorithms, and consult the documentation to expand your analysis possibilities.
If you have historical data that follows a clear periodicity, The FORECAST.ETS function provides more realistic estimates in contexts where there are regular peaks (e.g., monthly sales affected by season). Advanced parameters include automatic seasonality detection, missing data management through interpolation, and customization of the aggregation method for dates with multiple records.

Passionate writer about the world of bytes and technology in general. I love sharing my knowledge through writing, and that's what I'll do on this blog, show you all the most interesting things about gadgets, software, hardware, tech trends, and more. My goal is to help you navigate the digital world in a simple and entertaining way.