- The Event Viewer centralizes system, security, performance, and service logs such as Microsoft Defender for Endpoint.
- IDs 12, 13, 27 and 41 allow you to understand how Windows 11 starts and shuts down and to detect unexpected shutdowns or crashes.
- Custom filters and views make it easier to locate critical events, such as authentication errors or failures of specific services.
- Defender's advanced logs (onboarding, telemetry, ETW, and cloud connectivity) are key to diagnosing security and communication problems.
When Windows 11 starts to boot slowly, freezes for no apparent reason, or restarts on its own , the first impulse is usually to reinstall, run an antivirus scan, or blame the last game installed. However, the system itself keeps a very detailed log of everything that happens: the Event Viewer. If you know how to read these logs, you can understand what happens when you turn your PC on or off, why Microsoft Defender for Endpoint (MDE) fails, or what's behind a blue screen of death.
The goal of this guide is to teach you how to interpret Event Viewer logs in Windows 11 in a practical way , focusing on three main areas: system startup and shutdown events, using filters and custom views to pinpoint specific problems, and reading advanced events related to Microsoft Defender Endpoint (including ETW errors, telemetry, authentication, and cloud connectivity). Everything is explained in a straightforward and conversational style, while still covering the essential technical details.
What is the Event Viewer and what types of logs are there?
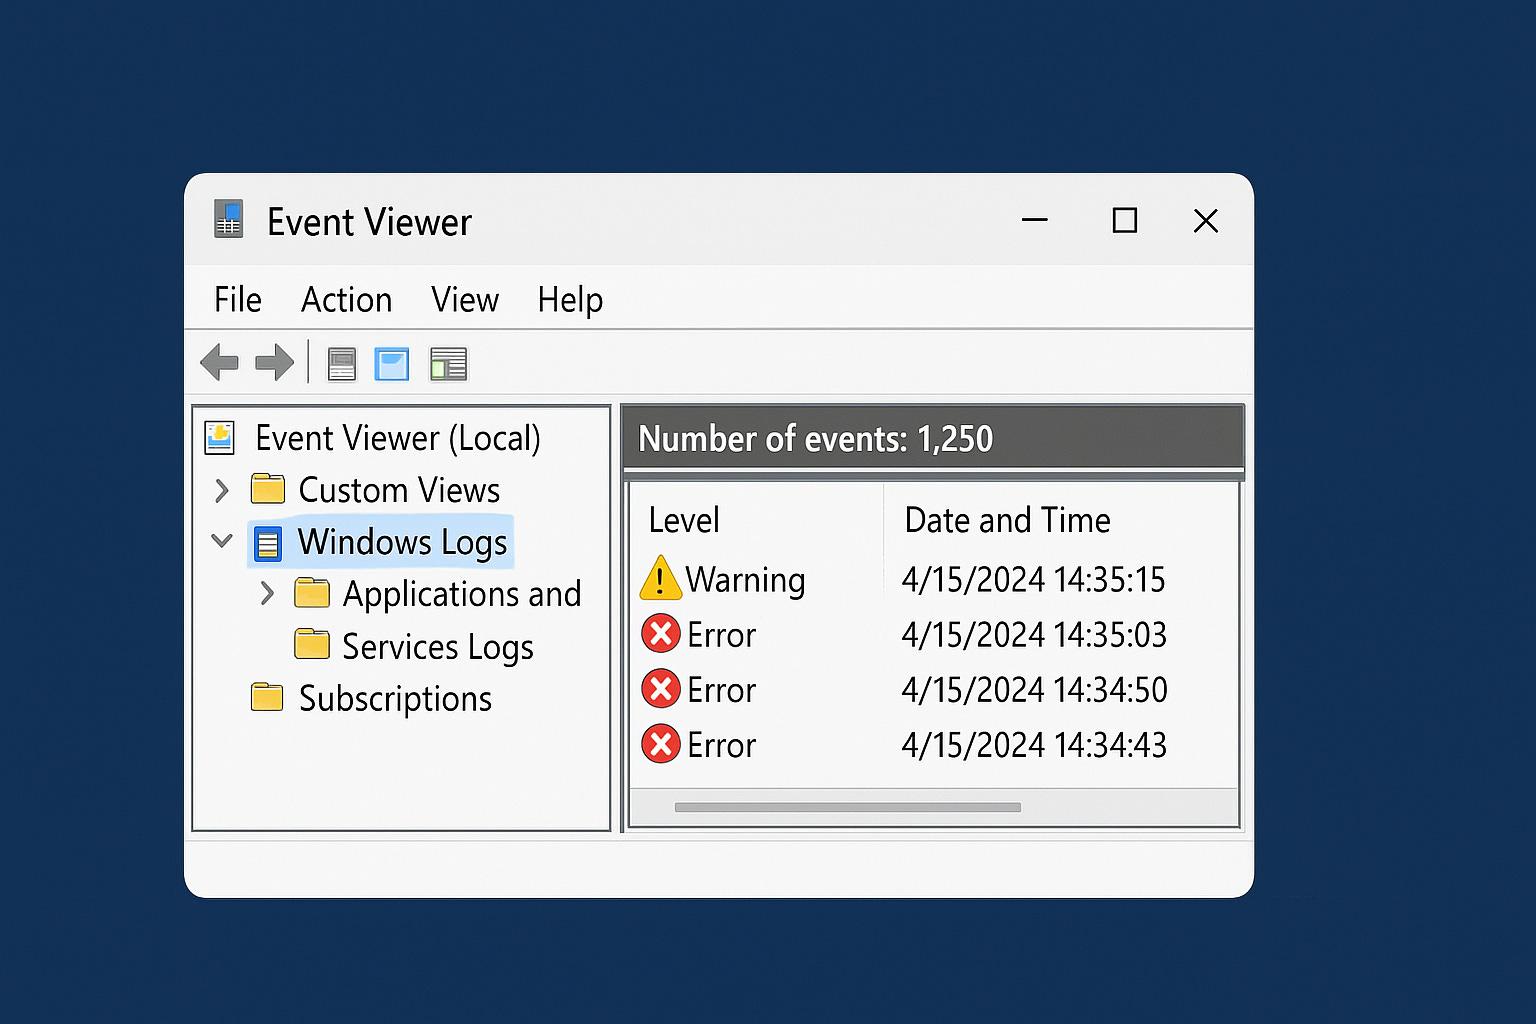
The Event Viewer is the central console where Windows logs virtually everything that happens to the system : startups and shutdowns, service errors, network problems, security breaches, application crashes, etc. It's not the prettiest tool in the world, but it is one of the most powerful for diagnosing problems in Windows 11.
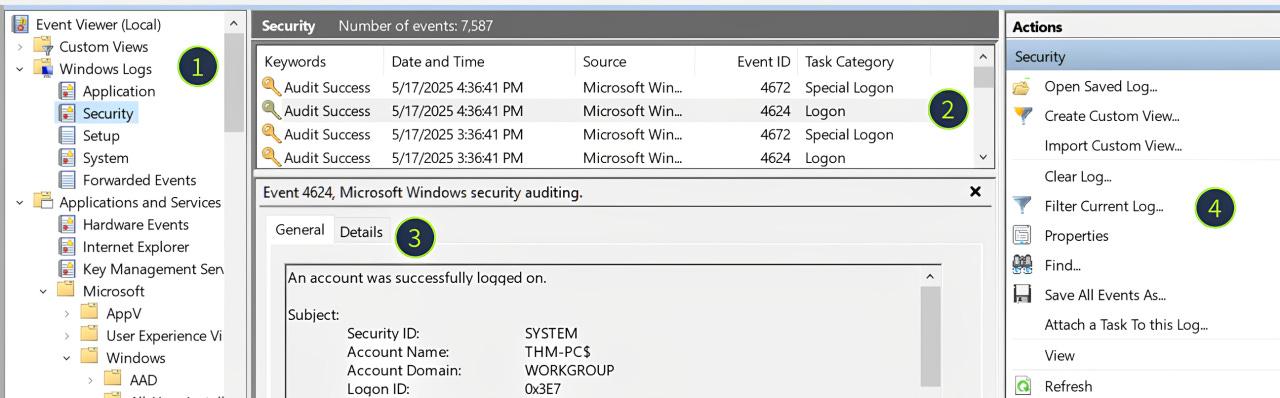
The Event Viewer's main window is divided into three panels : on the left, a tree with categories; in the center, the list of events; and on the right, the available actions (filter, save view, create task, etc.). This structure has been maintained since older versions such as Windows NT 3.1, although the application and service logs section has been greatly expanded in Windows 11.
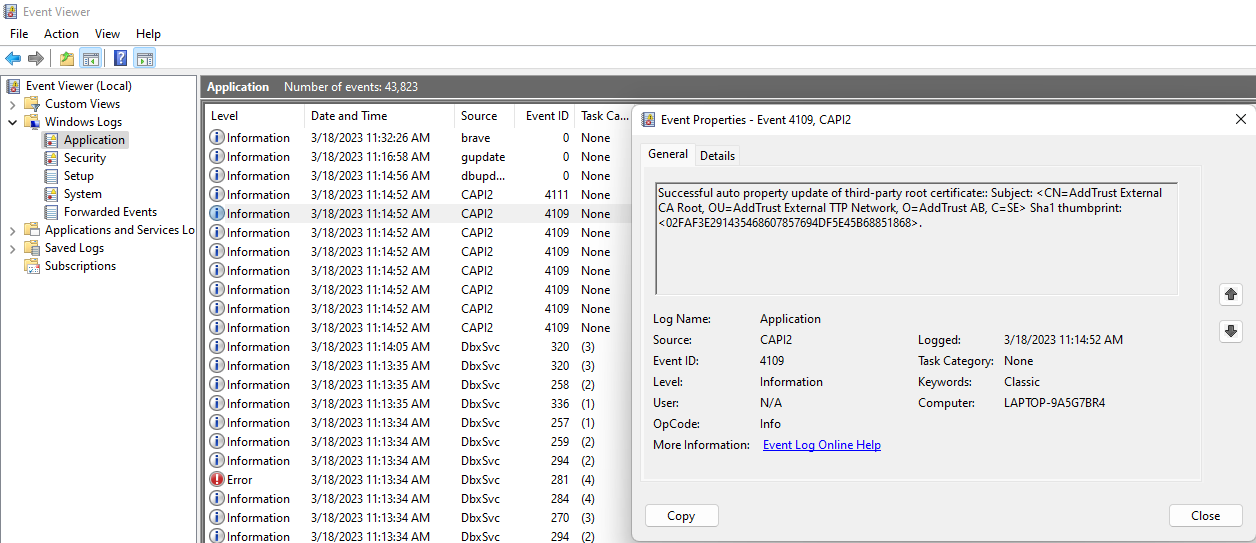
Within "Windows Logs" you'll find three key logs : Application, Security, and System. In the Application section, you can review installation logs . This is where most of the events you'll check when your PC is behaving strangely are concentrated, especially the System log for everything related to startups, shutdowns, and hardware or driver errors.
In “Application and service logs” you’ll find something more advanced : the Event Trace for Windows (ETW) providers. Here, each important component (for example, Microsoft Defender for Endpoint, telemetry, performance diagnostics, etc.) can have its own log. It’s the ideal place to debug very specific problems with a service or security feature.
How to open the Event Viewer in Windows 11 and navigate the interface
In Windows 11, you can access the Event Viewer in several ways , although the quickest is usually to use the Run dialog box: press Win + R, type eventvwr.msc , and confirm with Enter. After a few seconds, the console will open with the category tree on the left.
If you prefer navigating through graphical menus, you can also open it from the administrative tools . For example, you can open the Start menu, search for "Windows Tools," and within that window, locate the "Control Panel" shortcut. From there, go to "System and Security" to access the Event Viewer. It's a bit more involved, but it can be helpful if you're guiding someone less experienced.
Once inside, look for the "Event Viewer (Local)" entry in the left panel . From there you can select both the classic "Windows Logs" and the "Application and Services Logs," as well as the "Custom Views" section, where we'll later save filters so we don't have to configure them each time.
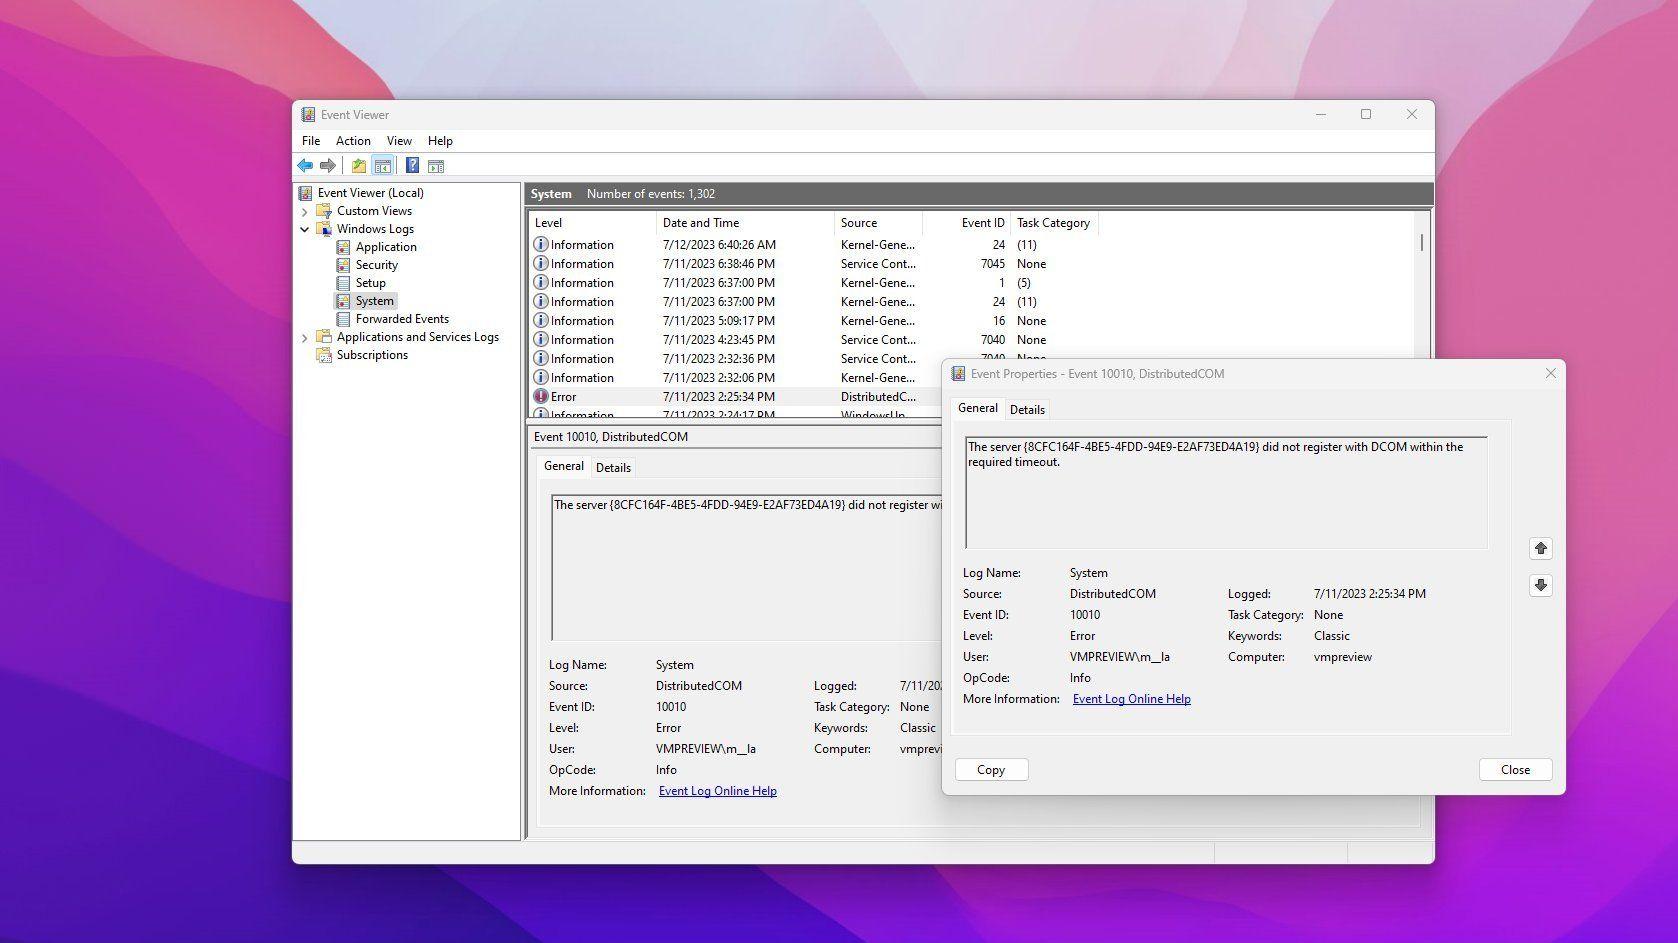
When you click on any of the records (for example, “System”) , the central panel fills with events: each row includes its date and time, the level (information, warning, error, critical), the source, the event ID, and a brief description. If you double-click on an event, a window opens with more details and two useful tabs: “General,” with clear explanatory text, and “Details,” with structured data.
The four types of boot that Windows 11 registers
Before interpreting startup and shutdown events, it's important to understand that Windows 11 doesn't always boot the same way . The system uses several startup and shutdown modes, and this affects both performance and the problems you might carry over between sessions.
"Fast Startup" mode is activated when you use the "Shut Down" option with the default settings . It's not a complete shutdown: Windows saves the kernel state to disk and reloads it on the next startup. It's faster, but it can cause some driver changes to fail or prevent certain updates from being applied correctly.
The "Restart" performs a complete shutdown and startup cycle from scratch . This unloads all drivers and processes, and initializes the system as if it were a clean boot. If your computer is acting strangely (stuttering, performance drops, minor graphics glitches), a true restart often resolves what a "quick startup" shutdown doesn't.
"Hibernation" saves not only the kernel state but also the state of open applications to disk . When you turn Windows on, it restores everything to its previous state. This is useful on laptops to avoid losing long sessions, but if there's an underlying problem, it can persist for several cycles.
A "full shutdown" only occurs if you disable fast startup or use specific commands like `shutdown /s /f /t 0` . In this case, absolutely everything shuts down, and the next boot will be a fresh one. Knowing what type of boot occurred is key to interpreting certain events, especially those related to ID 27 in the System registry, and to reviewing the boot log files.
How to filter the Event Viewer to see what really matters during startup and shutdown
When you notice that your PC takes a long time to start up, shuts down unexpectedly, or restarts on its own, the first thing to do is check the System log . In the left-hand tree, expand "Windows Logs" and click on "System." Then, in the right-hand panel, click on "Filter current log..." to keep only the key events.
In the filter window, in the "Event ID" box, enter these numbers separated by commas : 12, 13, 27, 41. These provide the most information about power cycles in Windows 11:
- Id 12This indicates that the operating system has started. It includes the exact time and the version of Windows that booted.
- Id 13This indicates that the system has shut down correctly. If ID 13 does not appear before ID 12, it means the previous shutdown was abnormal.
- Id 27: specifies the startup type. In the details you will see a numerical value: 0 is a full boot, 1 is a fast boot, 2 is a resume from hibernation, and 3 is a restart.
- Id 41Windows detects that the computer has restarted without shutting down properly. This usually corresponds to system crashes, BSODs (blue screens of death), or power outages.
To analyze a problem, review the sequence of events 13 → 12 → 27 → 41. For example, if you see an ID 41 followed by an ID 12, it means the system has restarted after detecting that the previous shutdown was not clean. If you don't find an ID 13 immediately before that in the same time frame, you know that something abrupt interrupted the previous cycle.
If you double-click on any event in the list, the "General" tab will display a plain text description . This allows you to see, without going into technical details, whether the startup was normal or if Windows is already warning you of a more serious failure (for example, a critical kernel or power manager error).
View startup and shutdown history with PowerShell
If you prefer to work with a cleaner, sortable list that you can save to a file, PowerShell is your ally . From its console, you can view the same events you see in the Event Viewer, but filtered and listed in a table.
Open PowerShell with normal privileges (administrator is not required) and run this command to obtain registry IDs 12, 13, 27, and 41 from the System registry:
Get-WinEvent -LogName System | Where-Object {$_.Id -in 12,13,27,41} | Select-Object TimeCreated, Id, Message | Format-Table -AutoSize
If you want to save this history to a text file for later review or sharing , add the following line to the end: | Out-File C:\starts.txt . You'll get a clear timeline showing when the computer was turned on and off, and if there were any critical errors in between.
Diagnose slow startups using performance events
When the problem isn't so much that the computer freezes but that it takes forever to log in, there's another very useful log : the performance diagnostics log. Microsoft uses it to measure how long the system takes to boot and which services or applications are slowing down the process.
In the Event Viewer tree, go to “Application and Services Logs” → “Microsoft” → “Windows” → “Diagnostics-Performance” → “Operational” . Once there, use the “Filter current log…” option again and enter 100 in Event ID.
The event with ID 100 records the total boot time in milliseconds , as well as detailing which applications and services took the longest to initialize. If you see values above 60000 ms (60 seconds) , you can consider the boot process abnormally slow and should investigate which component is causing the delay.
In the details of event 100, you'll see individual entries for specific processes . If a third-party application consistently appears with very high startup times, you can disable it from starting up or update it. The same applies to security services, poorly optimized hardware drivers, or cloud synchronization tools that fire at boot time.
Use advanced filters and custom views in the Event Viewer
When you're investigating a specific problem (for example, failed login attempts or errors with a specific service), basic filters fall short . This is where "Custom Views" come in, allowing you to save very precise criteria for later use.
To search for, for example, failed authentication attempts in the Security log , it's helpful to know that the ID for these events is 4625. In the left panel, make sure to select "Event Viewer (local)" and in the right panel, choose "Create custom view…".
In the window that appears, you can define several key parameters :
- Time interval: select a predefined range or use “Custom Interval” to set start and end date and time.
- Event LevelYou can limit yourself to critics, errors, warnings, etc., or leave it blank to include all levels.
- By registration o By originIf you choose "By log," you can select specific logs within "Windows Logs" or "Application and Services Logs." If you choose "By source," you directly select the component that generates the event (for example, the print spooler); the appropriate log will automatically be selected.
In the “Event ID” box you can play with several very useful combinations :
- A single identifier: for example, 4625 for failed logins.
- Multiple IDs: separated by commas, like 4624, 4625.
- Ranges: using a hyphen, for example 4650-4655.
- Mixture of ranks and loose IDs: 4698, 4700-4702, 4650-4655.
- Exclusions within a range: you can remove a specific ID by preceding it with a minus sign, for example 4698-4702, -4699.
In addition to the ID, the custom view allows you to filter by task category, keywords, specific users, or teams . This is very useful in environments with multiple users or on corporate networks, where you need to isolate events that affect a particular machine or account.
When you accept the filter, the system will prompt you to save the custom view . You'll need to provide a name (for example, "Startup Errors") and, optionally, a description. You can choose whether to save it in the main "Custom Views" folder or in a subfolder, or even create a new one. You can also choose whether the view will be available to all users or only to your account.
Once saved, the view will remain in the left panel of the Event Viewer . Each time you click on it, the list of events that meet those criteria will load. Keep in mind that the view is always up to date: if new events that fit the filter have been generated since the last time, they will automatically appear in the list.
Interpreting Microsoft Defender for Endpoint (MDE) Events
In addition to general Windows events, many organizations rely on Microsoft Defender for Endpoint (MDE) to protect their computers. This service generates a vast number of events that log its status, onboarding and offboarding processes, cloud connectivity, and internal errors.
MDE events typically indicate whether the service has started, stopped, connected, or not connected to the processing servers . For example, you'll see messages that "the Microsoft Defender for Endpoint service has started" during system boot or onboarding, as well as service shutdown events when the device is powered off or removed. These normal operating events usually indicate that "no action is required."
When errors occur, events include detailed codes to guide troubleshooting . For example, “Failed to start the Microsoft Defender for Endpoint service” with a variable error code indicates that the service has not started and usually recommends reviewing other related messages. Other events point to problems connecting to external processing servers (specifying the specific URL) and suggest checking connectivity, proxy settings, and internet configuration.
Onboarding and offboarding generate many specific events , ranging from "the service is not onboarded and no onboarding parameters were found" to errors reading those parameters, preserving onboarding information, or changing the service startup type. In almost all cases, the recommended action is to verify that the onboarding configuration and scripts have been deployed correctly and, if necessary, redeploy the configuration packages.
You'll also find events indicating that onboarding has been successful and that the device is now reporting to the portal . It even warns that the device may take several hours to appear in the admin console. Other events reflect the calculation of the Defender Device ID for the endpoint and the application of the default settings (which may temporarily fail).
Telemetry, ETW and auxiliary services involved in Defender
A significant portion of MDE logs relates to telemetry services and ETW (Event Tracing for Windows) sessions. Defender needs to record and send security and behavioral events to the cloud, and it relies on several system components to do so.
You'll see, for example, events related to the "User Experiences and Associated Telemetry Service" (diagtrack) . If this service fails to start, telemetry won't be sent from that machine, and the events will recommend checking the Microsoft-Windows-UniversalTelemetryClient/Operational log. There are also events indicating errors registering or unregistering this service, with specific error codes and a suggestion to ensure the diagnostic data service is enabled.
Regarding ETW, error events appear when creating or starting event tracking sessions , both for automatic MDE loggers and for "secure" loggers. Some errors indicate a lack of resources (due to an excess of active ETW sessions) and usually resolve themselves: the service re-attempts to start the session every minute, and when it succeeds, a recovery event is generated. More serious problems warrant restarting the device and contacting support if they persist.
There are also events related to problems adding providers to a specific ETW session . In these cases, events from the affected provider are not reported to the service until the error is resolved. If you see these messages repeatedly, you should review the error code and, if it's not a temporary issue, escalate the problem.
Finally, some events mention the security event minifilter controller (MsSecFlt.sys) . If the system cannot load it, it is recommended to restart the device and, if the problem persists, contact technical support, because without this component the collection of certain security events may be incomplete.
Cloud connectivity, quotas, and network issues in Defender
Microsoft Defender for Endpoint relies on constant communication with cloud servers to send telemetry, receive response commands, apply cloud configurations, and handle scenarios such as DLP classification.
In the logs, you'll find events indicating that the service has successfully connected to a specific URL on the processing servers . These events typically confirm that the address matches what you would see in the firewall or network activity and require no action. When the connection fails, events are logged that specify the URL and recommend checking connectivity, proxy settings, and internet configuration.
Communication quota management is also reflected . Some events report that disk and daily upload quotas in MB have been updated, while others warn that a Defender module is about to exceed its daily quota and may be temporarily limited. There are even events indicating that the sending of "cyber data" has been stopped because the quota has been exceeded and will automatically resume when the quota period ends.
Network and battery status affect how often Defender communicates with the cloud . Some events indicate that the network connection has been identified as "low" (for example, on a paid or metered network), and therefore, communication with the server will be less frequent. The same occurs when the battery is low: Windows reduces the communication frequency to conserve power. Other events indicate that the connection or battery has returned to a "normal" state, and the regular communication rate resumes.
Regarding DLP (Data Loss Prevention), there are specific events that alert you to cloud connectivity issues for this scenario . When the necessary connection is lost, an error is logged suggesting a network connectivity check; when it is restored, another event notifies you and confirms that the DLP sorting flow can continue normally.
Defender cloud configuration and response commands
Defender for Endpoint not only sends data to the cloud, it also receives instructions and configurations . The logs accurately reflect what happens with these "push" configurations and the commands executed on the device.
You'll see events indicating that an invalid cloud configuration has been received , typically including a version, status, error code, and message. In these cases, the file is skipped, and if the problem persists, contacting support is recommended. When the new configuration is successfully applied, an event is generated confirming the applied version and indicating that no further action is required.
If the new cloud configuration fails but the last known valid configuration can be applied , this is also logged: the incorrect version and the recovered valid version are recorded. In the worst-case scenario, when neither the new nor the last known valid configuration can be applied, the service reverts to the default configuration and schedules a new configuration download attempt in a few minutes. If the event indicating successful application (usually number 50 in that sequence) does not appear after this, it is advisable to contact support.
Regarding remote response commands, there are events that mark the start of command execution and others that confirm its successful execution. If an error occurs while executing the command, the event includes the command identifier and error code, and usually suggests that if the problem persists, you should report it to technical support.
There are also validations on the parameters of certain commands, such as those for data collection . If the arguments (for example, a SAS URI or the compression level) are invalid, an event is logged indicating that the arguments for the collection command could not be read or parsed. Again, if you see this message frequently, it's reasonable to review the policy that generates those commands and, if necessary, open a support case.
Authentication, keys, and CSP in Microsoft Defender for Endpoint
Another dense portion of Defender's logs relates to service authentication and cryptographic key management . Defender needs to register with an authentication service, generate keys, sign messages, and maintain persistent state to securely send and receive data.
There are events that indicate the service has been unable to generate or open a cryptographic key , or that it has been unable to maintain the authentication state. If a device stops reporting to the security portal and you see these events, it's a very clear indication that the problem lies within that authentication layer, and the recommendation is often to contact technical support if the issue persists after a restart or re-entry.
Other events confirm that registration with the authentication service was successful , that the cryptographic key was generated without issues, or that cyber telemetry uploads resumed after updating an expired token. These informational events generally do not require intervention.
The Configuration Service Provider (CSP) component also leaves its trail in the Event Viewer . You'll find events with identifiers in the 1800-1840 range that describe "Get" and "Set" operations on various values: onboarding status, onboarding and offboarding blob hashes, telemetry reporting frequency, sample sharing, group identifiers, device tagging parameters, and so on.
Many of these events simply indicate that a read or write operation has completed successfully , such as obtaining the organization ID during onboarding, checking if the service is running, or writing the onboarding blob to the registry. Others signal errors in "Get" or "Set" operations, especially when the requested values are outside the allowed ranges (as with sample sharing, reporting frequency, or device tagging parameters). In such cases, if the error recurs, it's usually necessary to review the MDM policy or configuration that pushes those values.
What to do when Windows 11 freezes and restarts on its own
A very common problem is a computer that freezes occasionally, restarts, and gets stuck in an automatic repair loop that almost never fixes anything. This can happen while playing games (like Fortnite) or simply while sitting on the desktop doing nothing.
If you want to use Event Viewer to investigate these crashes in Windows 11, the first step is to locate ID 41 events in the System log , as we saw earlier. These events will tell you that the system restarted without shutting down properly. From there, it's a good idea to review the immediately preceding events in both the System and Application logs to detect faulty drivers, disk errors, power issues, or critical services that stop.
In many cases, the problem originates in the hardware or drivers : temperature spikes, unstable power supplies, faulty RAM modules, or GPU controllers that crash. However, the events themselves can provide clear clues: if you see many errors from the same driver just before ID 41, you already have a prime suspect.
From there, combining the information from the Event Viewer with additional tools (such as disk checks, memory tests, or driver updates) is usually the most effective approach. The value of the Event Viewer isn't that it "fixes" the problem on its own, but rather that it helps you narrow down where to look, which service is failing, and at what exact moment everything breaks down.
Mastering the Event Viewer in Windows 11, understanding the different boot types, knowing how to filter by key ID, and reading the advanced Microsoft Defender Endpoint logs puts you in a much stronger position to diagnose almost any unusual system behavior. While the amount of information might initially seem overwhelming, once you become familiar with the patterns (IDs 12, 13, 27, and 41 for boot events; 100 for performance issues; and the various Defender onboarding and telemetry events), it becomes an indispensable tool that saves you time, unnecessary reinstalls, and a lot of headaches.


Passionate writer about the world of bytes and technology in general. I love sharing my knowledge through writing, and that's what I'll do on this blog, show you all the most interesting things about gadgets, software, hardware, tech trends, and more. My goal is to help you navigate the digital world in a simple and entertaining way.