- TCPView displays real-time TCP/UDP connections, with process and status.
- Allows you to close sockets, save evidence, and adjust DNS refresh and resolution.
- Tcpvcon and netstat cover console usage, filters, and CSV export.
- It is complemented by Nmap, Wireshark and other tools for a complete audit.
If you're wondering which devices your computer is currently "talking" to, you've come to the right place: Windows systems include tools to see this, and there are advanced utilities that make it even easier. TCPView, from Sysinternals (Microsoft), is one of the fastest ways to audit live connections without getting lost in the console.
In corporate or home environments, knowing which processes connect to the internet and which destinations they communicate with is vital for diagnosing problems, validating firewall rules, or detecting suspicious activity. In addition to netstat, TCPView adds a real-time view, color-coded highlights, and direct connection management , making it a practical replacement for daily auditing.
What is TCPView and why it is a practical replacement for Netstat?
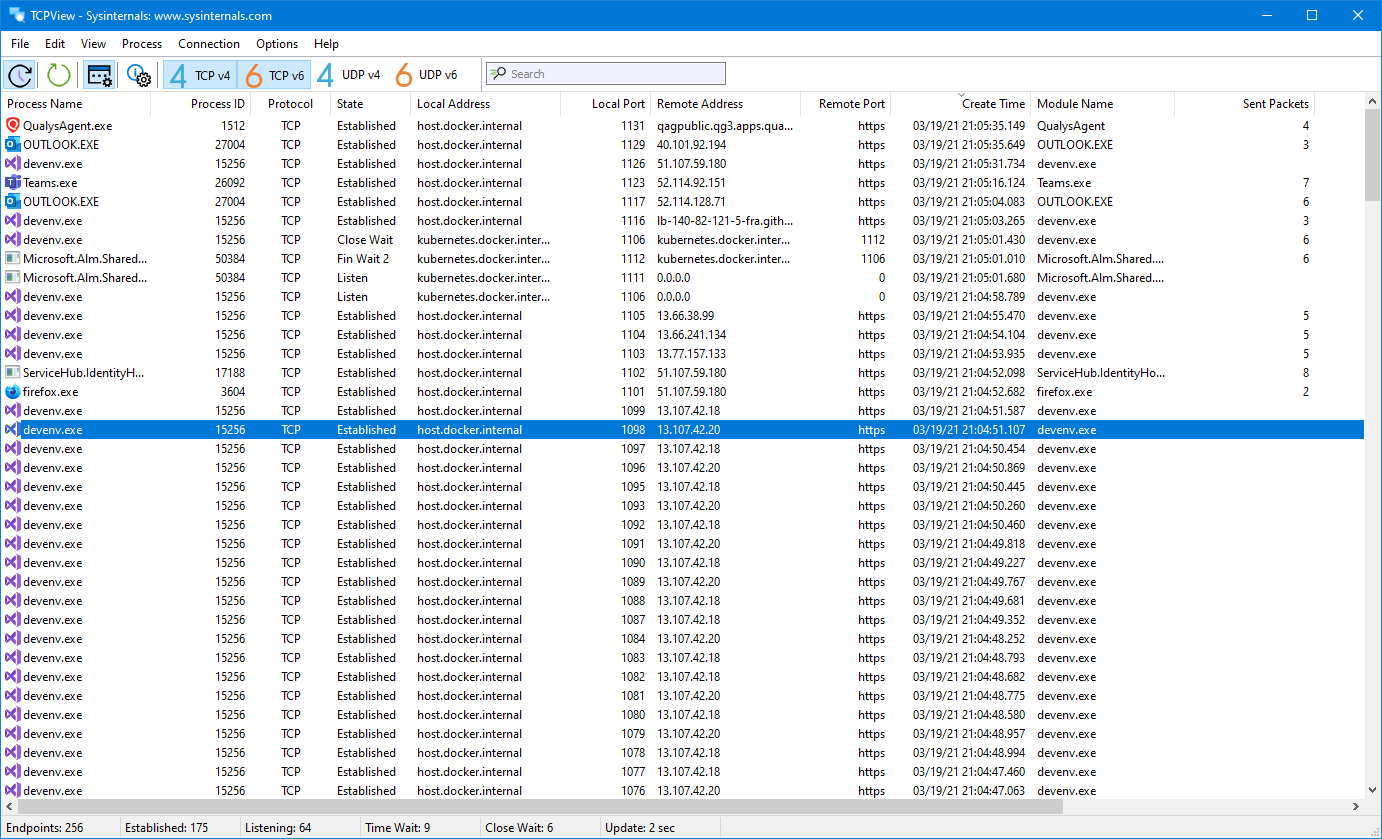
TCPView is a free utility from Microsoft Sysinternals that displays, in real time, all TCP and UDP endpoints on the system, along with their local/remote addresses and status (e.g., ESTABLISHED, TIME_WAIT). Unlike a text dump, its interface allows you to identify at a glance which process is behind each socket.
One of its biggest advantages is that, next to each connection point, you'll see the name of the owning process and, where applicable, the name of the associated service . This way, you not only detect the port and IP address, but also who opened it—essential for narrowing down network diagnostics or hunting for malware.
From a functional standpoint, TCPView offers a clearer and more actionable subset of netstat . The download package also includes Tcpvcon, a command -line version with equivalent capabilities for automating or logging from scripts.
By default, the view refreshes every second, though you can change this in Options | Refresh Rate . The program highlights changes between cycles: new endpoints in green, state changes in yellow, and dropped connections in red , so activity is effortlessly visible.
Another key advantage is that it allows you to act on what you see: you can close established TCP connections from File | Close connections or the context menu , which is especially useful for cutting off unwanted communications while you continue investigating.
If you need to preserve evidence or document a session, the application allows you to save the output to disk using the Save menu . And if you prefer human-readable hostnames, you can toggle DNS resolution from the toolbar or menu.
In terms of compatibility, TCPView works on Windows 8.1 and later on the client side, and Windows Server 2012 and later on the server side , thus broadly covering current desktop and server scenarios.
The official download is available from Microsoft, and you can also run the utility instantly with Sysinternals Live . The binary size is currently around 1,5 MB, although it was smaller in older versions; in any case, it's a portable tool that doesn't require installation.
For historical reference, the project is credited to Mark Russinovich and its documentation was recently updated (for example, on April 11, 2023). This ensures ongoing support and maintenance from the Sysinternals team.
Basic use of TCPView in Windows
When you open TCPView, the program lists all active TCP/UDP endpoints and, if enabled, resolves IP addresses to domain names for easier reading . You can enable or disable this resolution depending on whether you need fast analysis or numerical precision.
Look at the process, protocol, addresses/ports, and status columns: sorting by process or port helps you group activity and detect patterns (e.g., massive connections to SMTP or known command and control servers).
The constant refresh rate colors the activity: if you see a lot of green and red flashing frequently, it may indicate recurrent connection attempts, scans, or aggressive reconnections by an application . This color coding speeds up decision-making in critical moments.
Need to cut off traffic in real time? Select one or more rows with a set status and use File | Close Connections or right-click to close the socket . This is a temporary action (the app might reconnect), but it's useful for stopping exfiltration or spam while you adjust policies.
To gather evidence or share it with the team, it's advisable to save a screenshot of the window using the Save menu . This capture makes it easier to correlate events with firewall, IDS, or EDR logs and document the incident.
If your goal is to work with raw IPs, disable name resolution. In environments with internal DNS, the hostname can provide context, but numeric IPs prevent confusion from unwanted reverse lookups during a forensic audit.
A practical tip: Although TCPView doesn't require installation, run it with the appropriate permissions to see all activity. Opening it with elevated privileges ensures you can observe system processes and services that might otherwise be hidden from view.
Tcpvcon: the console version for automating audits
If you prefer to integrate auditing into scripts or schedule periodic logging, Tcpvcon offers the same command-line observability with very straightforward use . It's ideal for collecting status in batches or generating CSV files for later analysis.
Basic use of the tool:
tcpvcon [-a] [-c] [-n] [nombre_de_proceso_o_PID]The most useful modifiers are:
– -a : displays all endpoints (if you don't use it, you'll mainly see established TCP connections). Perfect for a complete system snapshot without filtering by state.
– -c : exports the output as CSV. Ideal for opening in Excel or feeding a SIEM with tabulated data of processes, ports, and states.
-n : does not resolve names; prints numeric addresses. Avoids DNS latency and maintains forensic accuracy in critical environments.
Quick example of a use case: you know the suspicious PID and want to list its activity without resolving names; simply using `tcpvcon -a -n 784` would show its active connections. Combining filters allows you to drill down into the details of a specific process with minimal effort.
Netstat for viewing active connections: when to use it and how to compare it
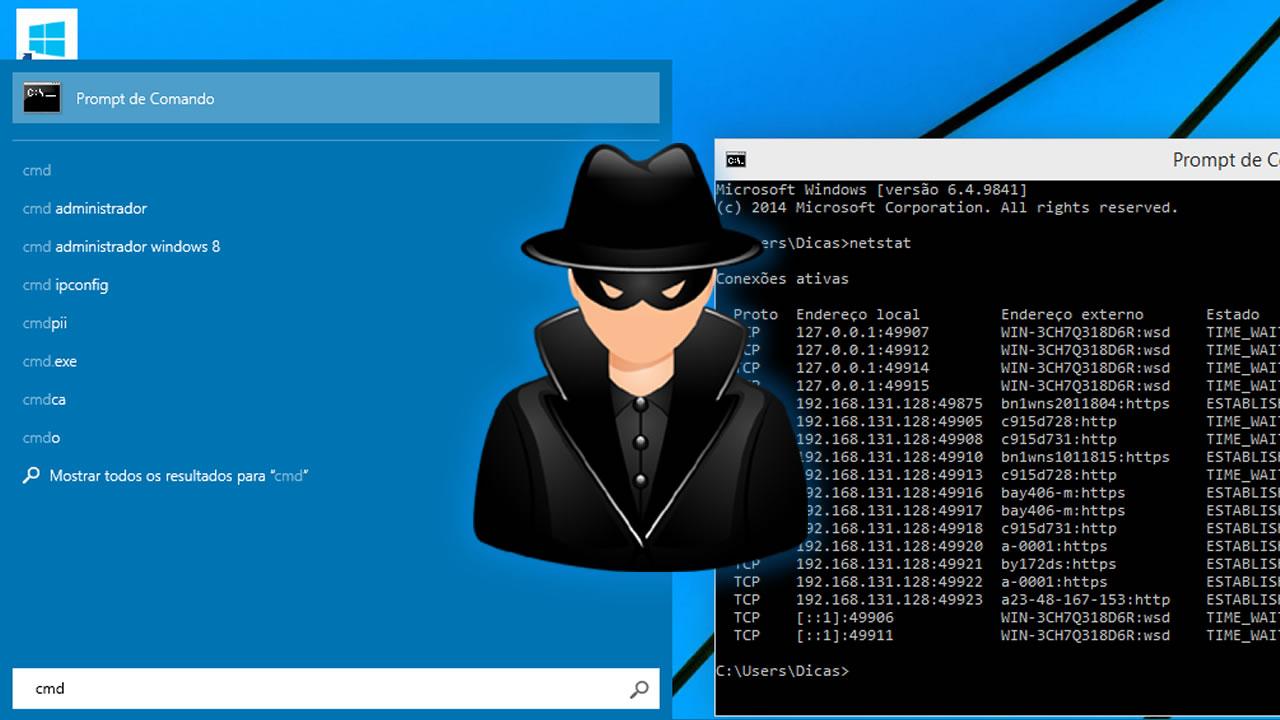
Netstat is the veteran of the field: it comes integrated with Windows and, when used properly, allows you to inspect TCP/UDP connections, listening ports, and their status . Its output is "more static" in the sense that it requires relaunching to update, but it remains valuable.
Key commands to have on hand:
netstat          # lista conexiones y puertos con nombres
netstat -n       # muestra IPs y puertos en formato numérico
netstat -a       # todas las conexiones y puertos en escucha
netstat -b       # requiere admin; muestra el ejecutable asociado
The -b modifier is especially useful for seeing which binary is behind a connection, but remember to open the console as administrator. Without elevation, some process information may not be displayed.
If you want live monitoring with color, visual filters, and the ability to close connections, TCPView will save you time . If you need something quick from the command line or you're on a server without a GUI, netstat or Tcpvcon are safe bets.
Real-life scenarios: detecting malware, SMTP spam, and firewall errors
A common scenario for small and medium-sized businesses: the ISP blocks port 25 due to spam detection. Instead of spending hours running antimalware on dozens of computers, you can launch TCPView on each PC (a one-minute task) and locate the culprit in seconds by viewing multiple simultaneous outgoing SMTP connections.
On computers compromised by Trojans that send bulk email, you'll see multiple remote destinations on port 25 or 587 with constant activity . Compared to a clean machine (without unusual spikes), the contrast is obvious and allows you to quickly isolate the affected computer.
Another scenario: a misconfigured port forwarding setting in the firewall leaves a server overly exposed. TCPView might show ephemeral connections from unknown remote IPs with low data volume. This could be internet noise, scans, or failed attempts , but it shouldn't be ignored.
In domain diagnostics, it's common to see connections associated with PID 4 (System) to domain controllers . This activity isn't necessarily malicious: the operating system and kernel services establish legitimate communications. The key is to correlate times, ports, and protocols with the server's functions.
If you have an IDS/IPS, the alerts provide context. For example, an alert about SERVER-WEBAPP Linksys E-series HNAP TheMoon (RCE attempt) indicates scans or attacks targeting vulnerable routers. It doesn't imply a compromise on your Windows host, but it does suggest reviewing your exposure and hardening your perimeter.
Good practices during research:
Freeze evidence saving TCPView output and firewall/IDS logs.
Check open services with netstat/Tcpvcon and compare them with the expected configuration.
Review NAT/port forwarding rules and close the unnecessary ones.
Check processes and signatures of suspicious executables with their path and publisher.
These actions, along with temporary connection cuts from the interface, help contain the incident while you plan permanent measures.
Complementary tools for a complete network audit
In addition to TCPView and netstat, it's worthwhile to use well-known network utilities that broaden your field of vision. Using them for defensive purposes gives you an advantage in understanding how attackers operate and helps you understand your attack surface.
– TCPDump and WinDump : command-line traffic capture tools. They allow you to dump packets for analysis and see what's flowing through the network . WinDump requires WinPcap/Npcap on Windows. They are powerful, but their learning curve is more technical.
– Nmap : a port scanner and service auditor. It sends predefined packets to IP ranges to discover hosts, open ports, services, and sometimes the operating system . It's essential for validating what you're actually exposing to the network.
– Wireshark : a protocol analyzer with a graphical interface. It allows you to inspect and decapsulate TCP/UDP packets in great detail , ideal for diagnosing subtle communication problems or studying protocols.
– Aircrack-ng : a wireless networking suite designed to audit the strength of WEP/WPA/WPA2 keys and analyze Wi-Fi packets . Useful for evaluating corporate Wi-Fi security and password policies.
Kali Linux : a penetration testing-oriented distribution that includes dozens of tools (including several of the ones mentioned above). It can be run live from USB or installed , and many utilities offer a graphical interface in addition to a console.
These solutions don't replace TCPView, but rather complement it: TCPView gives you the "who and now" at the process level , Nmap provides service exposure, and Wireshark/TCPDump offers packet visibility. Together, they form a robust workflow for detecting anomalies, confirming findings, and strengthening controls.
Download, execution and compatibility
You can get the utility from the official Microsoft Sysinternals website. The current download is around 1,5 MB and is provided as a portable binary . If you prefer not to download anything, you can also run it on the fly via Sysinternals Live directly from the internet.
Summary of execution requirements:
- Client: Windows 8.1 or later.
- employee: Windows Server 2012 or later.
To take full advantage of its capabilities, it is recommended to run it as administrator during troubleshooting sessions , especially if you are going to use netstat -bo and need to see system processes.
What should you choose for everyday use? For fast monitoring and triage, TCPView is agile, visual, and actionable . For scripting, inventory, and periodic logging, Tcpvcon and netstat cover the console workflow. In incidents with real suspicion, combine these views with captures and scans to move from hypothesis to evidence.
With such a lightweight tool and the ability to isolate specific sockets, you gain time to implement permanent corrective measures (firewall policies, service hardening, segmentation, or even reinstallation when most prudent). This balance between visibility and immediate action is precisely where TCPView shines.

Passionate writer about the world of bytes and technology in general. I love sharing my knowledge through writing, and that's what I'll do on this blog, show you all the most interesting things about gadgets, software, hardware, tech trends, and more. My goal is to help you navigate the digital world in a simple and entertaining way.