- Comprehensive analysis of classification, regression, clustering, and natural language processing metrics.
- Advanced validation strategies and techniques to mitigate overfitting and algorithmic biases.
- Integration of technical indicators with business KPIs and continuous monitoring tools in production.

Launching an Artificial Intelligence model into the world is exciting, but let's be honest: building the algorithm is just the tip of the iceberg. The real challenge lies in knowing whether that model actually works or if it's just selling us a bill of goods with results that only hold true in the lab. Without a rigorous evaluation system , we risk deploying solutions that, far from helping, introduce dangerous biases or provide completely misguided answers in real-world settings.
Mastering model validation isn't just a whim of data purists; it's an absolute necessity for any developer who wants to deliver tangible value. In this article, we'll break down all the metrics and strategies you need to master to transform your prototypes into robust and reliable solutions , from choosing specific indicators for each problem to using Python tools that will make your life easier.

Metrics for Classification Models: Beyond Simple Accuracy

When the goal is to assign a label to data, the first thing we usually look at is accuracy . Although it's very intuitive because it tells us the percentage of total correct answers, it can be a deadly trap if we have unbalanced classes. Imagine a model that detects fraud where 99% of transactions are legitimate; if the model always says "no fraud," it will have 99% accuracy but will be completely useless to the business.
To avoid being misled, Sensitivity (Recall) and Specificity come into play . Recall is vital when we can't afford to miss a positive case, such as in medical diagnosis where a false negative is critical. On the other hand, specificity is key when false positives are the problem, such as preventing an important email from ending up in the spam folder. To balance both, we use the F1 Score , which is the harmonic mean between accuracy and sensitivity, and is the key metric when there is a data imbalance.
For a comprehensive view, the ROC curve and the AUC-ROC are powerful tools. While the curve shows the trade-off between true positive and false positive rates at different thresholds, the AUC gives us a single number between 0 and 1. A value close to 1 indicates that the model is excellent at discriminating between classes, while 0.5 means the model is performing poorly.
Evaluating Regression: Measuring the Error Size

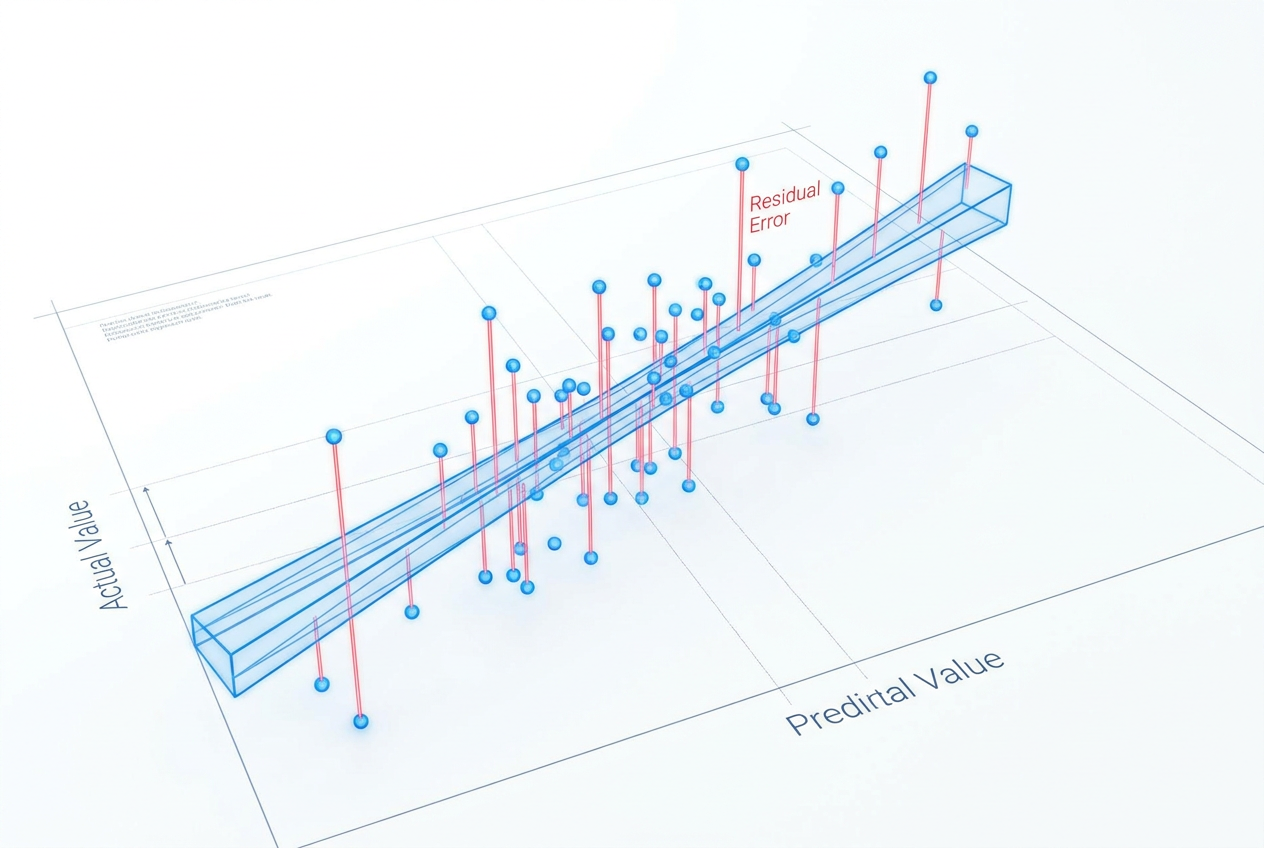
In regression models, where we aim to predict a continuous value, we no longer speak of successes or failures, but rather of the magnitude of the error . The Mean Absolute Error (MAE) is the easiest to explain because it gives us the average difference in the same units as our variable, making it very robust against outliers.
If we want to penalize large errors more severely, we use the Mean Squared Error (MSE) , which squares the differences. Since the MSE changes the scale of the result, we usually take the square root to obtain the RMSE , which returns to the original units but maintains that sensitivity to large errors. Finally, the R-squared tells us what percentage of the data variance is explained by the model, helping us to know if our input variables are truly capturing the essence of the phenomenon.

Specialized Techniques: Clustering and NLP
When we enter unsupervised territory like clustering, we no longer have actual labels to compare. Here we use intrinsic metrics such as the Silhouette Coefficient , which measures how compact a group is and how separated it is from others. We also have the Davies-Bouldin Index , where a lower value indicates better cluster separation.
In the world of Natural Language Processing (NLP), things get more complicated. For machine translation, we use the BLEU Score , which compares the machine to a human using n-grams. For automatic summarization, ROUGE is better , focusing on recall. And when it comes to language models, Perplexity is the key metric: the lower it is, the better the model predicts the word sequence.
Strategies against Overfitting and Robust Validation

The biggest fear of any AI engineer is overfitting , which occurs when the model memorizes data instead of learning patterns. To avoid this, the golden rule is to divide the data into three blocks: Training, Validation, and Testing . The test set should be sacred and used only once at the end of the process to obtain an unbiased estimate.
To strengthen the results, we applied K-fold cross-validation , dividing the data into 'k' parts and rotating the validation set at each iteration. This reduces variance and ensures that performance doesn't depend on a lucky data split. Another interesting technique is bootstrapping , which creates multiple subsamples with replacement to obtain more stable confidence intervals.
Ethics, Biases, and Algorithmic Accountability
A model can have brilliant technical metrics and, at the same time, be an ethical disaster. Sampling bias occurs when the data doesn't represent the actual population, causing the AI to fail with certain demographic groups. There's also association bias, where the model perpetuates social stereotypes present in historical data.
To combat this, we must implement Equity Metrics , evaluating performance separately for each subgroup. The use of Explainable AI (XAI) is crucial here, as it allows us to open the black box and understand why the model makes certain decisions, ensuring that it is not based on discriminatory variables.
From Technology to Business: The Real Value of AI
There's a classic disconnect between the data team and management. An engineer might celebrate an F1 score of 0.9, but the manager is interested in how much money the company is saving or how it's improving the customer experience. That's why it's vital to combine technical metrics with business KPIs such as reduced operating costs or increased Net Promoter Score (NPS).
To communicate this, AI dashboards are the ultimate tool. They shouldn't be a bunch of complex charts, but rather a bridge that translates technical performance into strategic impact. A good dashboard should include data drift alerts , notifying you when performance drops because the real world has changed and the model needs retraining.
Practical Implementation with Python and Scikit-Learn
Python is the king of languages for this thanks to libraries like scikit-learn. With functions like confusion_matrix, classification_report y roc_auc_scoreWe can obtain a complete diagnosis in just a few lines of code. For larger projects, tools like MLflow or Weights & Biases They allow you to track experiments and compare model versions professionally.
In the specific case of computer vision with models like YOLO , we use metrics such as mAP (mean Average Precision) and IoU (Intersection over Union) . IoU tells us how much the predicted box overlaps with the actual box, and mAP summarizes the overall accuracy across all classes, allowing us to fine -tune the model to optimize the detection of small objects or improve the confidence of the predictions.
Having complete control over evaluation means mastering everything from confusion matrices and log-loss analyses to Gini coefficients and Kolmogorov-Smirnov tests. By integrating technical validation with ethical oversight and financial objectives, we transform a simple code experiment into a strategic business asset that constantly evolves through production monitoring and iterative improvement.

Passionate writer about the world of bytes and technology in general. I love sharing my knowledge through writing, and that's what I'll do on this blog, show you all the most interesting things about gadgets, software, hardware, tech trends, and more. My goal is to help you navigate the digital world in a simple and entertaining way.