- Access and configuration of developer tools using shortcuts and context menus.
- In-depth analysis of the DOM and CSS styles to improve accessibility and responsive design.
- Performance audit and resource load monitoring via the Network and Lighthouse panel.
- WPO debugging and optimization techniques to boost SEO positioning.

If you work in the web industry, whether designing, programming, or trying to make sure your site isn't invisible on Google, you've probably come across the " inspect element" button at some point . It's simply the gateway to Chrome DevTools, an arsenal of tools that lets you delve into the inner workings of any website to understand how it functions, fix bugs on the fly, or simply explore what's behind the visual facade.
The best part is that you don't need to install anything unusual; the browser already has it built in. From analyzing why an image takes forever to load to modifying CSS in real time to see how a red button would look without touching the server-side code, Chrome DevTools are an invaluable tool for anyone looking to optimize the user experience and technical performance of their project.

How to get into the heart of DevTools
There are several ways to open this control panel, depending on what you find most convenient. The most intuitive is to right-click anywhere on the webpage and select "Inspect." If you prefer keyboard shortcuts for speed, on Windows and Linux you can press Ctrl + Shift + I , while on Mac the combination is Cmd + Option + I. You can also press the F12 key, which often acts as a toggle to open and close the panel.
Once inside, you can choose where you want the window to be positioned: docked to the right, to the left, at the bottom, or even in a separate window , which is great if you have multiple monitors and want to view the website on one and the code on another.
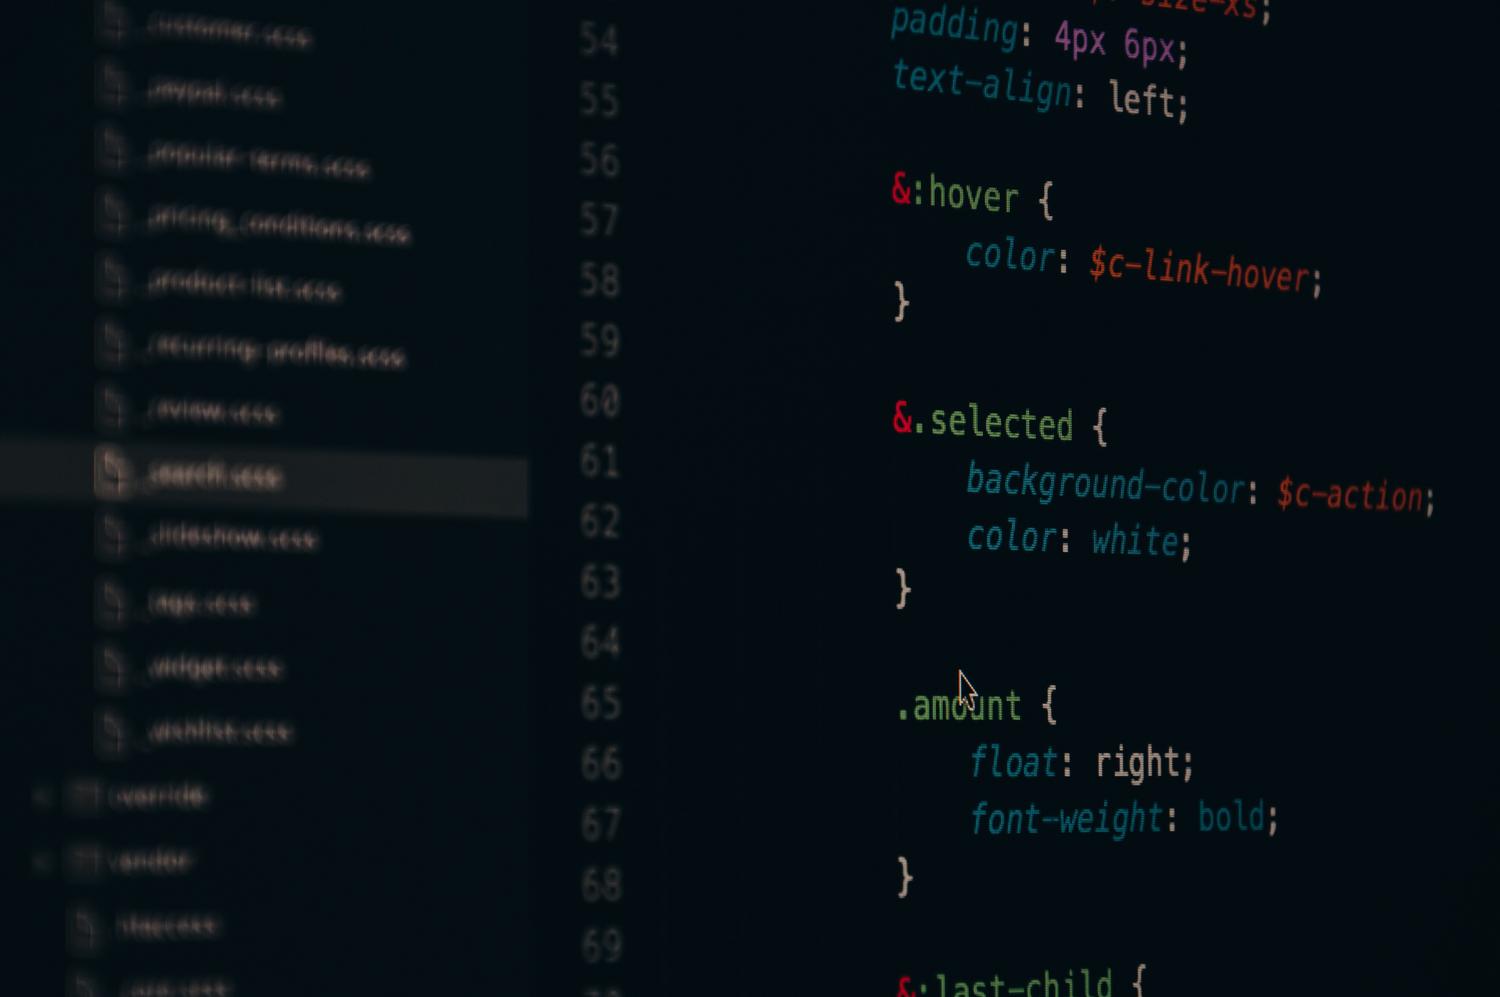
The Elements Panel: The skeleton and skin of the web
The Elements tab is where the magic of the DOM (Document Object Model) happens. Here you don't see the static HTML code sent from the server, but rather the actual, dynamic representation of the page, including anything JavaScript has generated on the fly. It's the ideal place to check that your semantic markup is correct, which is fundamental for on-page SEO.

If you activate Inspection Mode (the arrow icon in the upper left corner), you can hover your mouse over the website and see precise details: pixel dimensions, background colors, margins, and padding. It even alerts you if the color contrast is insufficient, which is critical for web accessibility . Furthermore, you can remove distracting elements, such as cookie banners, or edit the text directly using Design Mode via the console.
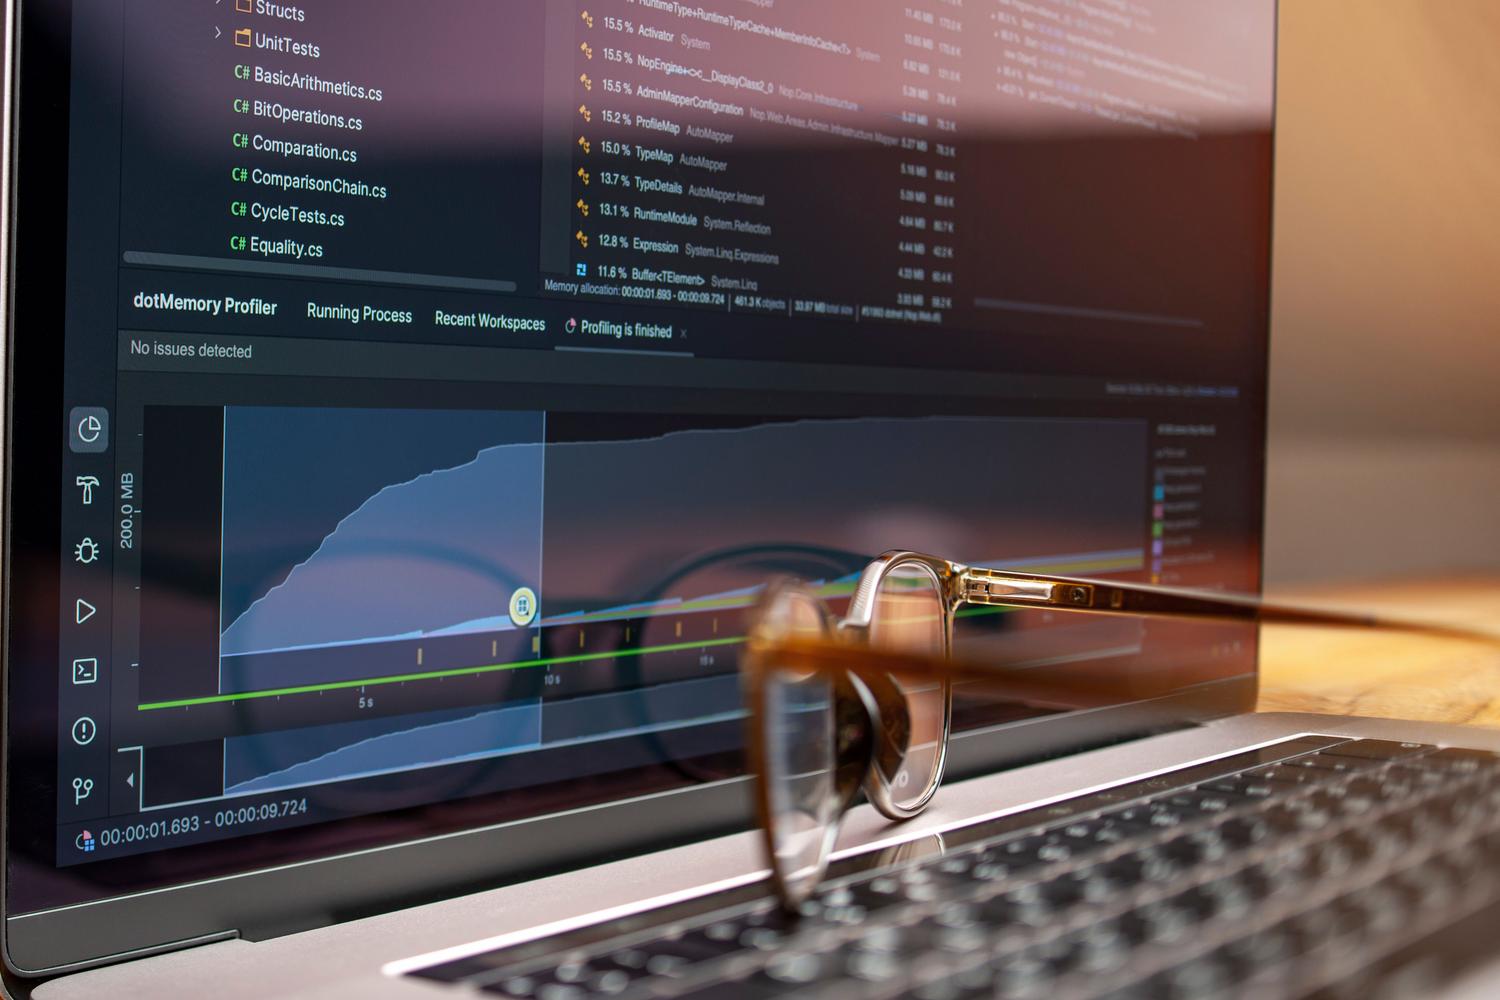
Mastering the Network tab
When a website is slow, the Network Panel is the first place to look. This tool logs every file that is downloaded: images, scripts, fonts, and the HTML itself. When you reload the page, you'll see a chronological list showing the HTTP response status , the resource type, and the file size.
To analyze page load times professionally, it's vital to use the "clear cache and reload" option , as this simulates the experience of a new user. Additionally, Chrome allows you to simulate slow connections (like 3G), which is essential for determining if your website is usable on mobile devices with poor coverage. If you want to go even further, you can enable screenshots to see exactly how the page renders second by second as resources are downloaded.


WPO Optimization and Performance with Lighthouse
Web Performance Optimization (WPO) is the art of making a website fly. Among the DevTools, we find Lighthouse , an auditing tool that analyzes speed, accessibility, and best practices. Unlike other external tools, Lighthouse gives you concrete suggestions for improving loading time and rendering.
To optimize performance, it's recommended to review the Sources and Network tabs to identify any excessively large CSS or JS files that should be minified or combined . You can also determine if you're loading too many resources from external domains (such as Google Fonts) and consider whether hosting them on your own server would be more efficient in reducing HTTP requests.

Advanced tricks for developers and SEOs
If you need to debug JavaScript errors, the Console is your best friend. A very useful trick is to use the `$0` variable in the console , which directly references the last element you selected in the Elements panel. On the other hand, if you want to know what happens when a resource fails, you can use the request blocking feature to simulate that a CSS file or API is unavailable and see if the website remains functional.

For those looking to extract data, the "Copy element" function allows you to export the structure of an entire table or list to a code editor or even use it with ImportXML in Google Sheets. All of this, combined with responsive design that emulates different mobile devices, makes DevTools a complete technical analysis suite.
The intelligent use of these tools allows you to transform a slow, poorly structured website into an optimized platform that Google rewards in its rankings. Mastering element inspection, network analysis, and performance audits isn't just for programmers, but for anyone who wants to ensure a seamless user experience and strong search engine rankings.


Passionate writer about the world of bytes and technology in general. I love sharing my knowledge through writing, and that's what I'll do on this blog, show you all the most interesting things about gadgets, software, hardware, tech trends, and more. My goal is to help you navigate the digital world in a simple and entertaining way.