- Microsoft Project offers automatic and customizable reports for monitoring projects.
- Allows you to export data to Excel or Power BI for advanced analysis and detailed visualizations.
- The software includes predefined templates and options to generate customized reports according to each need.

Generating reports in Microsoft Project is one of the most valued features for project managers and teams who want a clear and professional overview of their tasks and resources . Being able to transform data into visual and understandable information is key to decision-making and effective project monitoring.
In the following article, you'll discover how to create, customize, and share reports in Microsoft Project , covering all options both from within the software itself and through complementary tools like Excel and Power BI. I'll also show you how to get the most out of predefined and custom templates and help you identify the most useful reports based on your specific tracking needs. All of this will be explained in detail, clearly and concisely, and in an accessible style so that whether you're a beginner or an advanced user, you can master Project reports.
What are reports in Microsoft Project and why are they so useful?
Microsoft Project reports allow you to visualize and analyze the status of a project graphically and in detail, without requiring additional software. Using customizable charts, tables, and dashboards, these reports help identify progress, delays, cost overruns, and resource allocations, facilitating communication with the team and stakeholders.
One of the main benefits is that they update automatically as the project progresses , eliminating the need for manual reviews. Furthermore, you can fully customize the content and appearance of each report to suit your monitoring needs or those of your superiors.
Types of reports available in Microsoft Project
Microsoft Project offers a comprehensive set of predefined reports covering various key project areas. You can easily find them on the Report tab and quickly access dashboards, resource reports, cost reports, progress reports, and even evolution reports.
- Panel reports: They present global information about the project status, milestones, upcoming tasks and delays.
- Resource reports: They allow you to see the use and over-allocation of resources involved in tasks.
- Cost reports: Properly structured to control budgets, deviations and accumulated amounts.
- Progress reports: They reflect progress, critical or postponed tasks, and compliance with deadlines.
- Custom reports: You can create your own templates tailored to any specific needs.
Each type of report serves a specific purpose and is fully customizable, both in terms of data and visual appearance.
How to create and customize reports in Microsoft Project
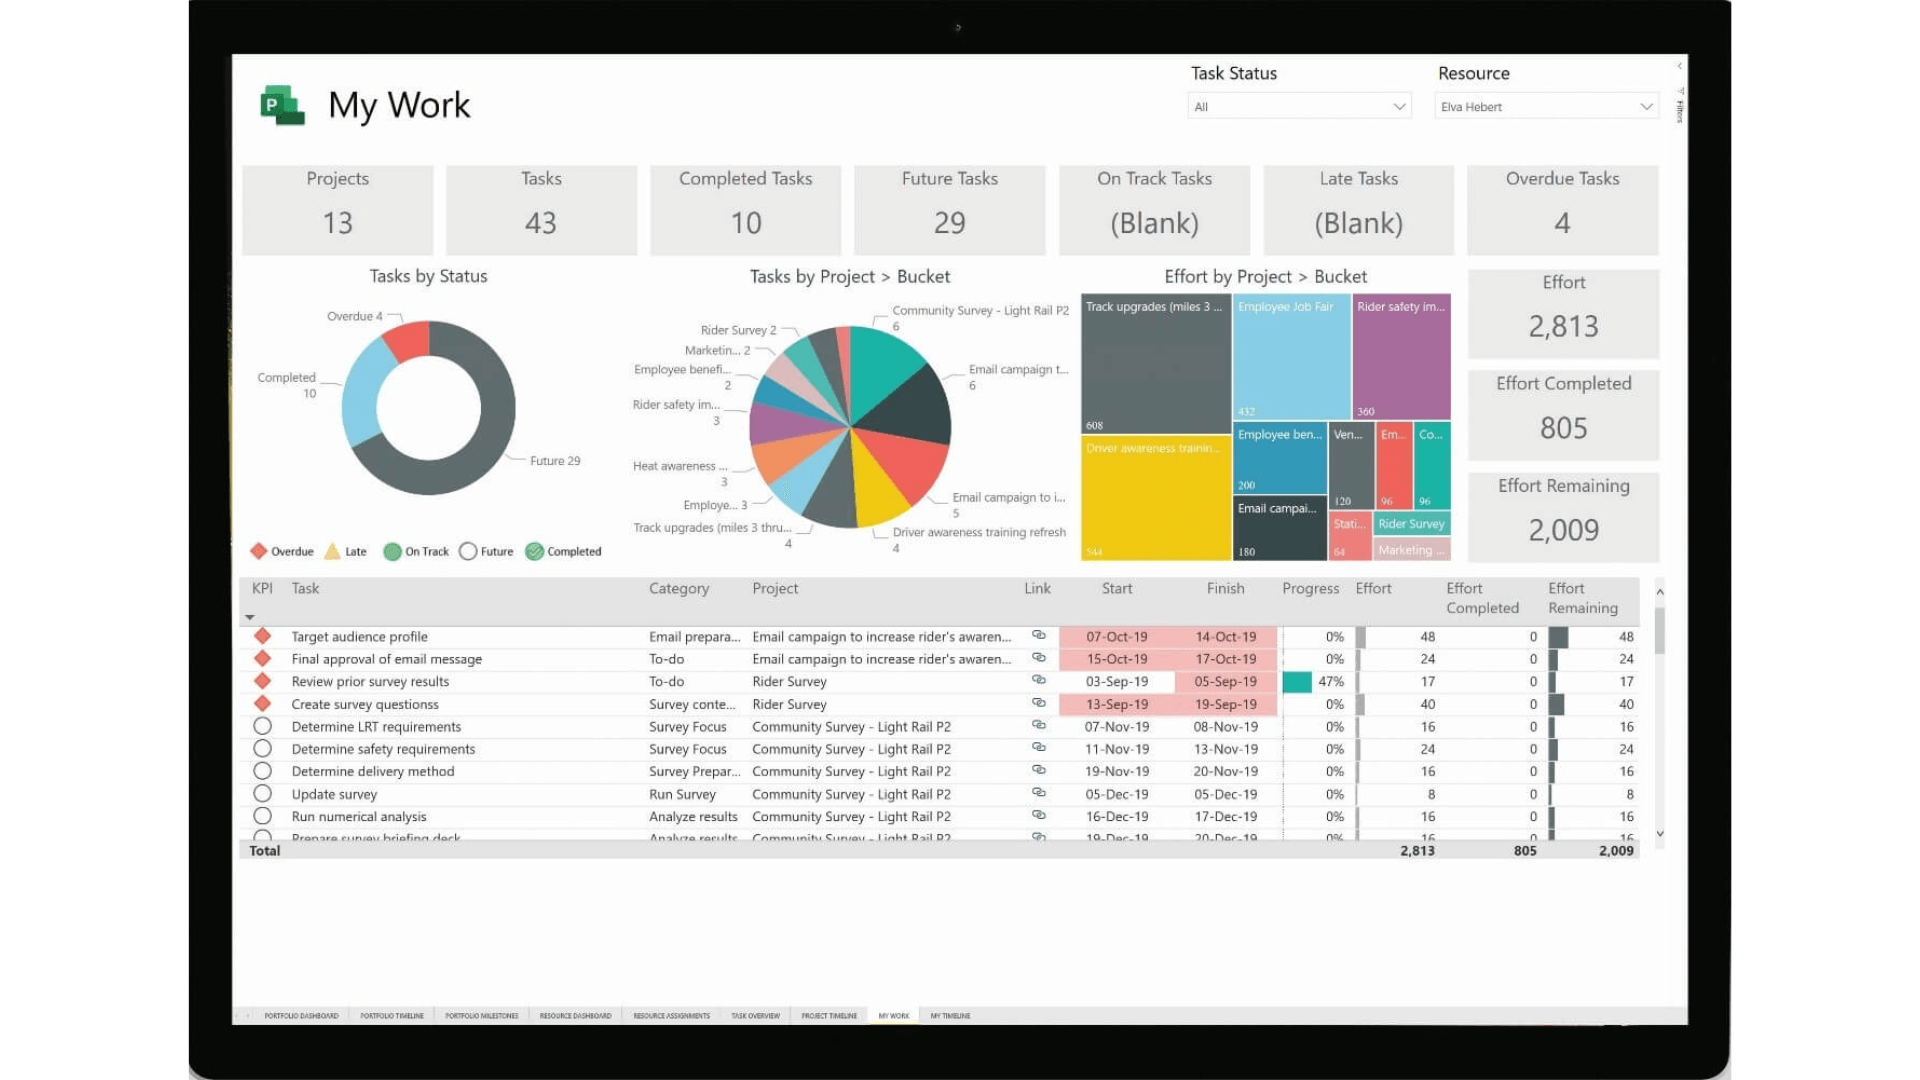
Creating a report in Microsoft Project is simple . Just go to the Report tab and select the desired report type. Then, you can adjust the data and design to suit your preferences and needs.
- Go to the tab Report in the top menu.
- In the group View reports, select the category and report you want.
- Customize the information and appearance from the options panel: change fonts, colors, graphics, images, etc.
For example, if you need an overview report, select Dashboards > Project Overview . This report combines charts, tables, and summaries to show the progress of each phase, upcoming milestones, and overdue tasks.
Want to customize it to your needs? You can change the displayed data by clicking on the table or chart and using the Field List panel to select the necessary fields and apply filters. This way, you can tailor the information to the recipient or the context of your tracking.
Advanced report customization: change data, format, and appearance
Microsoft Project stands out for its powerful report customization capabilities . It's possible to control both the data displayed and the visual design.
- Select the report area that you want to modify (table, graph, panel).
- From the tab Design of reporting tools you can enjoy Change fonts, colors, themes, or add images, shapes, and new tables.
- If you need a change in the data, use the panel List of fields to show or hide columns, filter by critical tasks, resources, or specific periods.
- You can add custom fields, modify chart styles, and move elements around to make your presentation more professional and attractive.
A practical example: If you have a percentage completion chart and want it to show only critical subtasks, select the chart, go to the filter, choose “Critical Tasks,” and adjust the outline level to focus on the relevant information.
Creating Fully Customized Reports: Steps and Templates
If the predefined reports don't meet your needs, you can always create your own reports from scratch . Microsoft Project offers basic templates to facilitate this process:
- In white: Perfect for designing a completely customized report. You can add any element (charts, tables, text, images).
- Graphic: Includes a chart ready to customize with your preferred fields and data.
- Panel: A table that you can customize by adding or removing fields and changing the structure based on the schema levels.
- Comparison: Two parallel graphs to analyze different variables in a comparative manner.
To start a custom report, select Report > New report , choose the desired template, and give it a name. From that point on, you have complete freedom to build the report to your liking, adding the sections, fields, and visual resources you need.
Options for exporting and sharing reports
Often, it's necessary to share reports with others or present them on different platforms. Project allows you to:
- Copy the report: Choose Report Tools | Design > Copy Report and paste it into any compatible program (Word, PowerPoint, email, etc.).
- Print reports: If you prefer the paper version or PDF, you can print with the highest quality and format.
- Export to Excel: If you use Project for the Web, you can export the project to Excel from the menu option (... > Export to Excel). This way, you can easily manage customized, visual reports or send information to external parties.
Integration with Excel and Power BI for advanced reporting
In addition to Project's built-in options, you can get the most out of your project data using Excel and Power BI . For example, if you want to create more complex reports in Microsoft Project , these tools offer greater flexibility and visual appeal.
Exporting to Excel gives you access to tasks, summaries, dates, and completion percentages in a spreadsheet. This allows you to archive copies, print summaries, build dashboards, and perform more advanced analysis using Excel's built-in functions.
Power BI Desktop is another powerful option for advanced visualization and analysis. With the appropriate license, you can directly connect to Project data and use pre-designed templates for visually stunning and easily interactive reports. To create or customize these reports, you need a Project Plan 3, Plan 5, or Power BI Pro subscription.
Main predefined reports in Microsoft Project
Project features multiple ready-to-use reports and dashboards that make project monitoring and tracking easy:
- Evolution: Compare planned, completed, and pending work. Ideal for agile management and Scrum, gives an at-a-glance view of the project's progress.
- General cost information: Analyzes whether the project is within budget, showing planned and actual costs and deviations.
- General project information: Indicates percentage completed, upcoming milestones, and overdue tasks.
- Upcoming tasks: Helps identify tasks to be started soon and those with issues.
- Overview of resources: Allows you to know the workload and tasks assigned to each person.
These reports provide a clear and detailed view of progress, costs, resources, and key milestones to help you keep your project on track.
How to work with progress reports in Project
The progress report is especially useful for visually comparing planned versus actual work . It includes two main charts: one showing completed work and another showing task progress. Both are automatically updated as work progresses.
To set up these reports to display useful data, make sure that:
- Resources are assigned to tasks, to accurately record the work performed.
- Establish a baseline before starting, thus obtaining a snapshot of the project that will serve as a reference for the reports.
- Indicate the percentage of tasks completed; only those that are 100% complete are considered in the reports.
Additionally, you can add customizable work and task fields to further refine your tracking and gain a more realistic view.
Visual reports in Excel and Visio
If you have Excel or Visio installed, Project allows you to directly export project data into visual report templates:
- Excel: You will be able to create dynamic charts to analyze expected costs, remaining work, resource availability, etc.
- Vision: Allows you to generate visual diagrams that facilitate the monitoring and presentation of key project data.
From the Report > Visual Reports tab , you can select the desired template and automatically generate an Excel or Visio file with all the processed information.
Reports in Project Online: Library and Examples
If you have Project Online, you have a library of reports on the website itself, accessible from the Reports option or via Settings > Site Content . There you'll find pre-designed examples that you can use as a starting point, and which are based on OData connections, allowing the reports to be updated automatically without any additional manual effort.
Among the main sample reports available are:
- Project Overview Panel: Provides views of assignments, tasks, risks and issues, as well as key summaries for management.
- General project information: Allows you to segment by project and graphically view its progress and the number of tasks and assignments.
- General resource information: Analyzes the planned, actual, and assigned work for each resource, as well as showing the number of tasks per person.
What if you need even more customization in your reports?
The built-in and sample reports are designed to cover most needs, but Project lets you go further. You can create new, custom reports, dashboards, and visualizations from your own data, whether within Project, Excel, or Power BI. This level of customization ensures you can tailor your reports to the level of detail required by your organization or project type.
Microsoft Project offers a complete environment for generating, customizing, and exporting visual, cost, resource, progress, and custom reports. Leveraging these tools will give you complete control over your projects , optimize decision-making, and improve communication within your team and with stakeholders.


Passionate writer about the world of bytes and technology in general. I love sharing my knowledge through writing, and that's what I'll do on this blog, show you all the most interesting things about gadgets, software, hardware, tech trends, and more. My goal is to help you navigate the digital world in a simple and entertaining way.
Table of Contents
- 1 What are reports in Microsoft Project and why are they so useful?
- 2 Types of reports available in Microsoft Project
- 3 How to create and customize reports in Microsoft Project
- 4 Advanced report customization: change data, format, and appearance
- 5 Creating Fully Customized Reports: Steps and Templates
- 6 Options for exporting and sharing reports
- 7 Integration with Excel and Power BI for advanced reporting
- 8 Main predefined reports in Microsoft Project
- 9 How to work with progress reports in Project
- 10 Visual reports in Excel and Visio
- 11 Reports in Project Online: Library and Examples
- 12 What if you need even more customization in your reports?