- Visio makes it easy to create all types of flowcharts and processes with intuitive templates and shapes.
- Diagrams in Visio help visualize complex processes and improve communication in professional teams.
- There are alternatives like MindOnMap or EdrawMax for those looking for online or simpler options.
Have you ever wondered how to bring your ideas or processes to life in a single glance?Visio diagrams are one of the most effective and visual ways to achieve just that. Whether you want to capture a business process, organize tasks in your company, or simply better understand how different stages of a project connect, knowing how to create diagrams in Visio will open up a world of possibilities for better communication and more organized work.
In this article you will discover Everything you need to know to create flowcharts in Visio, from the most basic aspects to Tricks Advanced tutorials that will allow you to get the most out of this powerful Microsoft tool. If you've ever felt intimidated by its interface, don't worry: I'll explain everything step by step in clear language, and I'll also share alternatives in case you're looking for equally effective options.
What is a flowchart and why use Visio to create one?
Un Flowchart It is a graphical representation that shows the sequential steps of a process. They are used to Visualize processes, make decisions, document systems, or communicate information easily.. Thanks to Symbols and standardized forms, anyone can quickly interpret how information flows or what step comes next in a sequence.
Businesses and professionals turn to flowcharts to Show basic business processes, industrial circuits, key decisions or even organizational hierarchies. Visio stands out precisely because it makes it easy to create these diagrams using Pre-designed templates, shape libraries, and an intuitive interface which speeds up the work even for those who have not used the tool before.
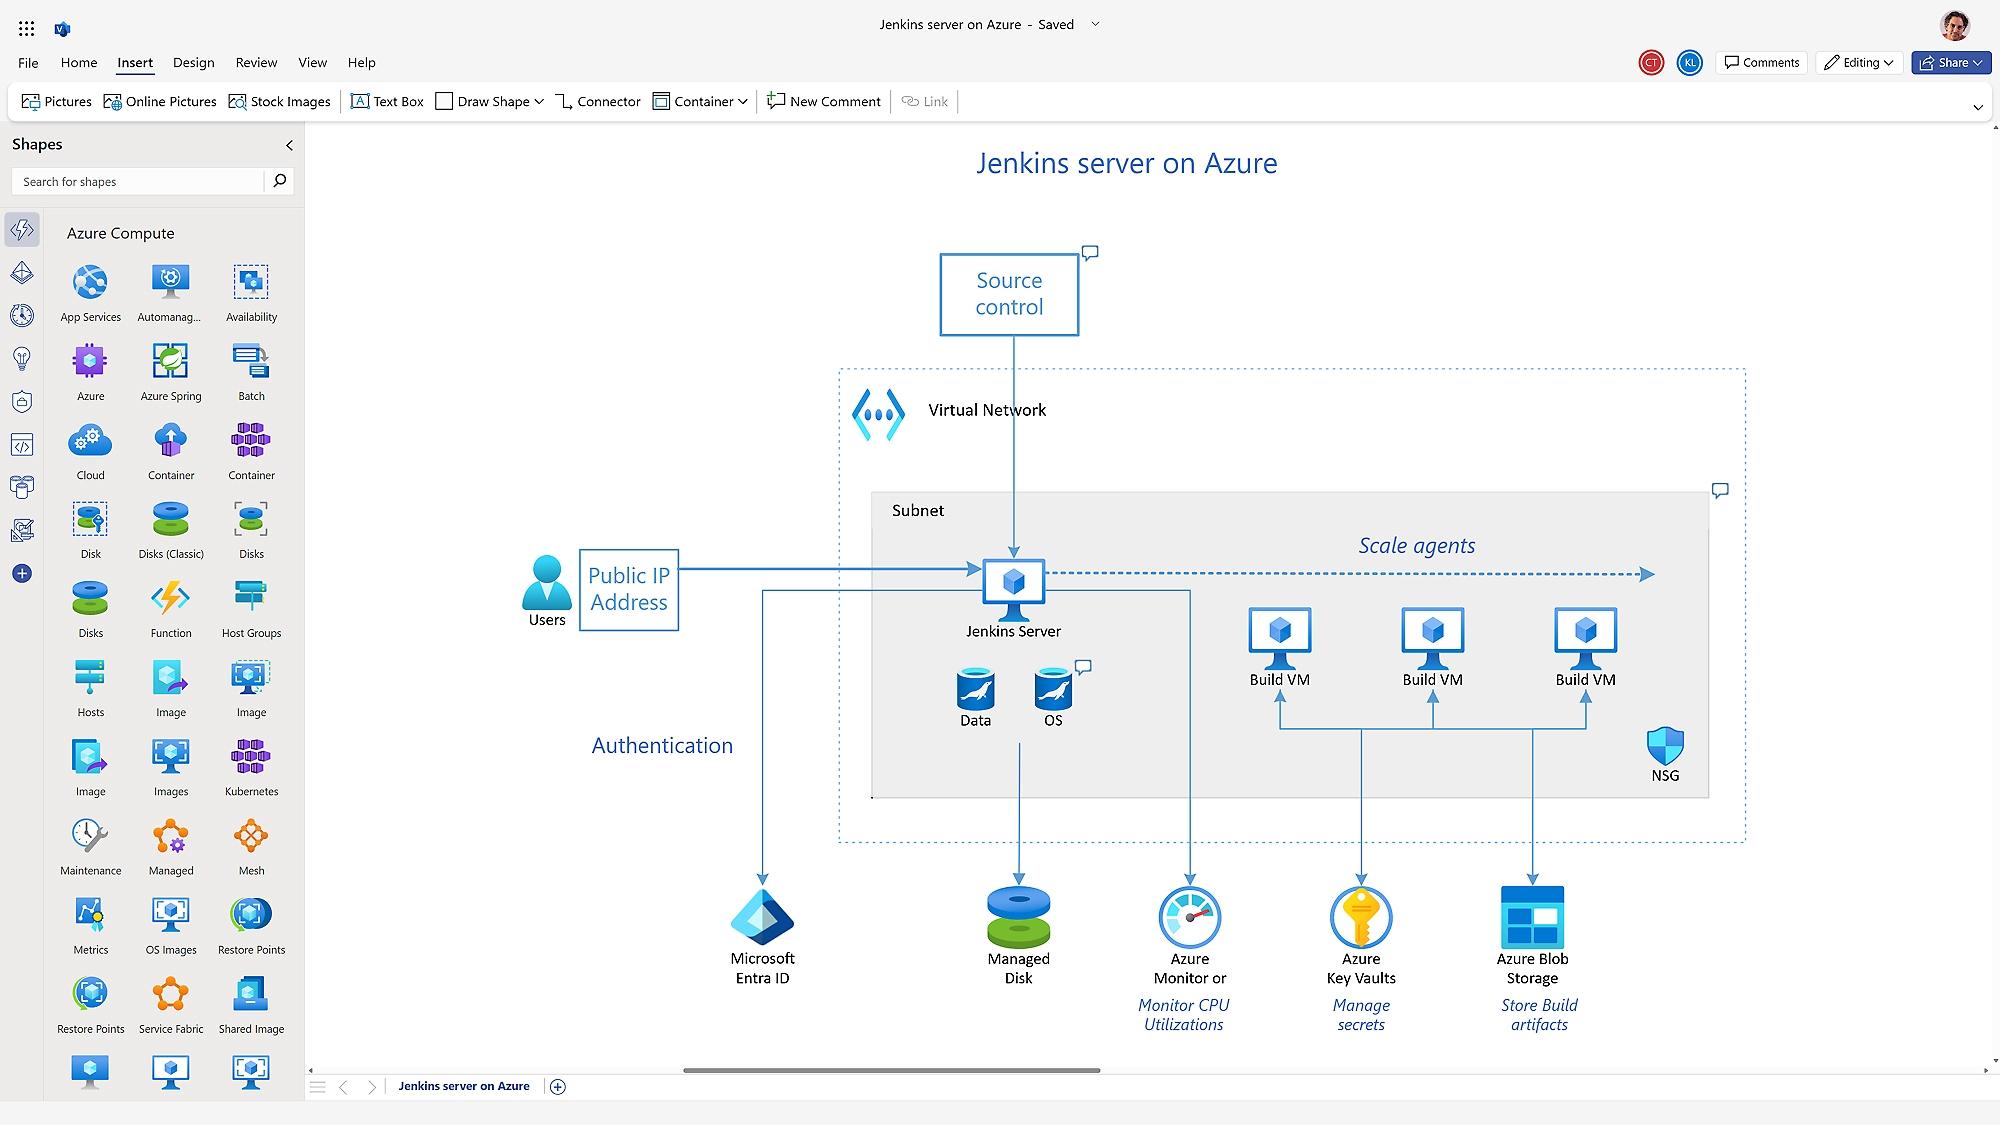
Thanks to the popularity of Visio within the business environment, you can not only create flowcharts, but also industrial process diagrams, organizational charts, network maps, floor plans and much more.
Main advantages of using Visio to create diagrams
Among the Most notable advantages of Visio for the elaboration of diagrams are:
-
- Wide variety of templatesFrom simple flowcharts to highly complex graphics for engineering, architecture, or industrial processes.
- Extensive library of shapes and symbols: Allows you to drag and drop standard elements, such as rectangles, diamonds, ovals, and connectors, to create clear, professional diagrams.
- Integration with other tools Microsoft Office: Makes it easy to import data from Excel or Access, as well as easily share diagrams in Word and PowerPoint.
- full customization: Adjust colors, line styles, arrows, and fonts to make each diagram fit your needs or corporate image.
Ability to export and import: Save your diagrams in different formats (PDF, PNG, JPEG, VSDX) and allows you to work on files previously created in other programs.
Plus, Visio is available in different editions, so you can choose the one that best suits your projects or the size of your business.
Step by Step: How to Create Flowcharts in Visio
Let's see now How to create your first flowchart in Visio, even if you start from scratch:
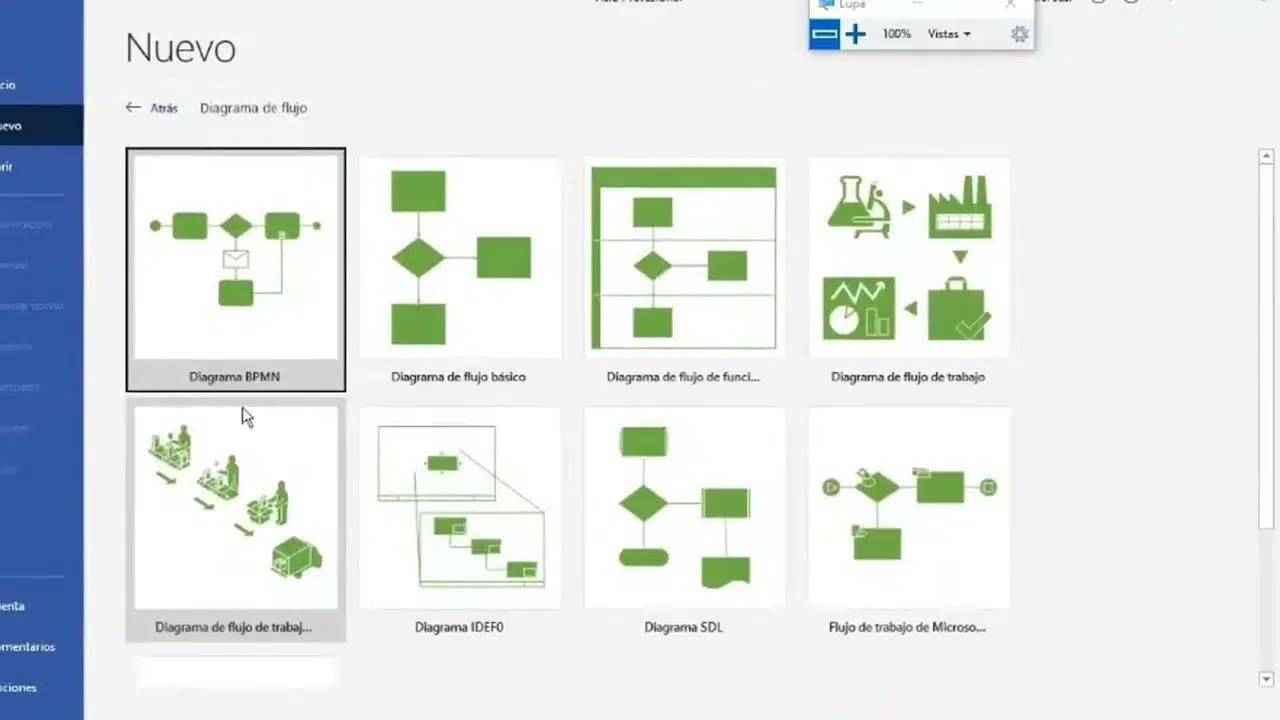
- Open the Microsoft Visio programIf you already have an Office 365 subscription, you may already have access. If not, you can explore the options available for your team.
- Select the “Flowchart” category to get started. Here you'll see pre-designed templates (such as the basic flowchart or process diagram).
- Choose a blank template or one of the suggested optionsIf you're looking for clarity, start with the basic template.
- Drag shapes from the tool panel to your worksheetUse ovals to indicate the start and finish, rectangles for steps, and diamonds for decisions.
- Connect the shapesHover over the shape you want to link, select the arrow, and drag it to the next shape. This creates the process flow.
- Add text to each shape by clicking on it and typing directly inside. For connectors, select the line and add the necessary information.
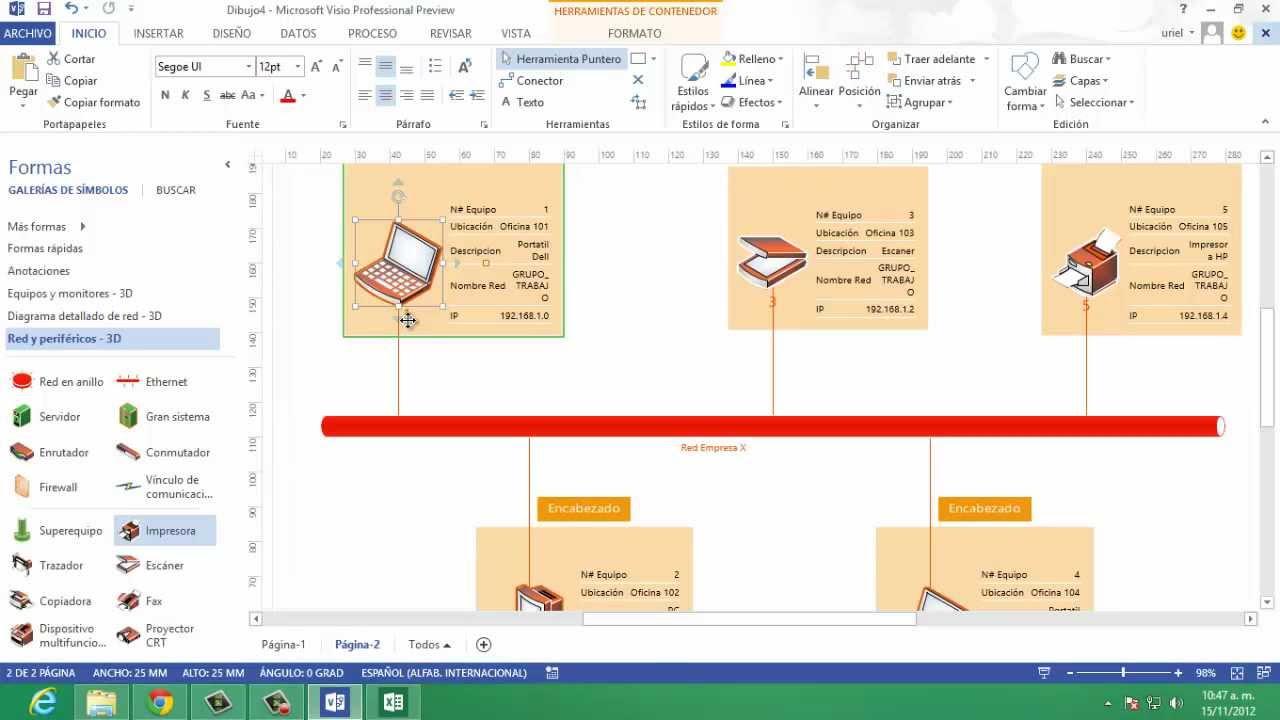
- Customize the design and styles. Change colors, fonts, arrow types, and line styles from the “Format” tab.
This process is not only easy, but with a little practice, it will allow you to create visually compelling diagrams that are perfectly understandable to any member of your team or executive audience.
Types of diagrams and symbols you can use in Visio

One of the strengths of Visio is the wide variety of shapes and symbols that integrates, providing clarity and structure to your diagrams. The main elements you can use include:
- Ovals or ellipses: They represent the beginning or the end of a process.
- Rectangles: They indicate an action or activity to be performed.
- Diamonds: Used to show decisions that affect flow, they imply a fork.
- Arrows and connectors: They indicate the direction or sense of the flow of information or actions.
- Parallelograms: They denote the input or output of data.
This makes it easy to represent in a single diagram not only the process itself, but also its variations, possible branches, and key points where important decisions are made.
Additionally, if you work in more technical environments (such as engineering, chemistry, or industrial processes), the process flowchart template in Visio includes specific forms for each field, helping to standardize documentation and reports.
Advanced tips to get the most out of Visio
As you gain experience, you can Explore more advanced Visio features:
- Take advantage of data import: Connect your diagram to Excel or other data sources so that the information is automatically updated.
- Use the layers function: Organize your diagram into different levels of detail, allowing you to view only what is relevant at any given time.
- Use collaborative commentsIf your team is working on the same diagram, you can easily leave notes or comments.
- Save and retrieve custom templates: Create your own libraries of recurring shapes and themes to save time on repetitive tasks.
- Export to different formats: Share your diagram as a PDF, image, or even as an editable version for others, making sharing and collaboration easier.
These tools make Visio not just a drawing program, but a robust platform for documenting and communicating business processes of any size.
Simple alternatives to Visio for creating flowcharts
If at any time you feel that Visio is too complex or you do not have a license, there are equally effective online alternativesOne of the most notable is MindOnMap, which allows you to work directly from your browser and features:
- Wide collection of shapes, from circles to diamonds and ovals, seamlessly integrated into the interface.
- Customizable themes and templates to adapt the design to your company's style or the purpose of the diagram.
- Options for adding icons and branches, which facilitates the visual interpretation of the process.
- Ability to create organizational charts, tree diagrams, fishbone diagrams and other schemes, not just flow ones.
The advantage of these platforms is their ease of access, as they require no installation and can be used for free or from any connected device.

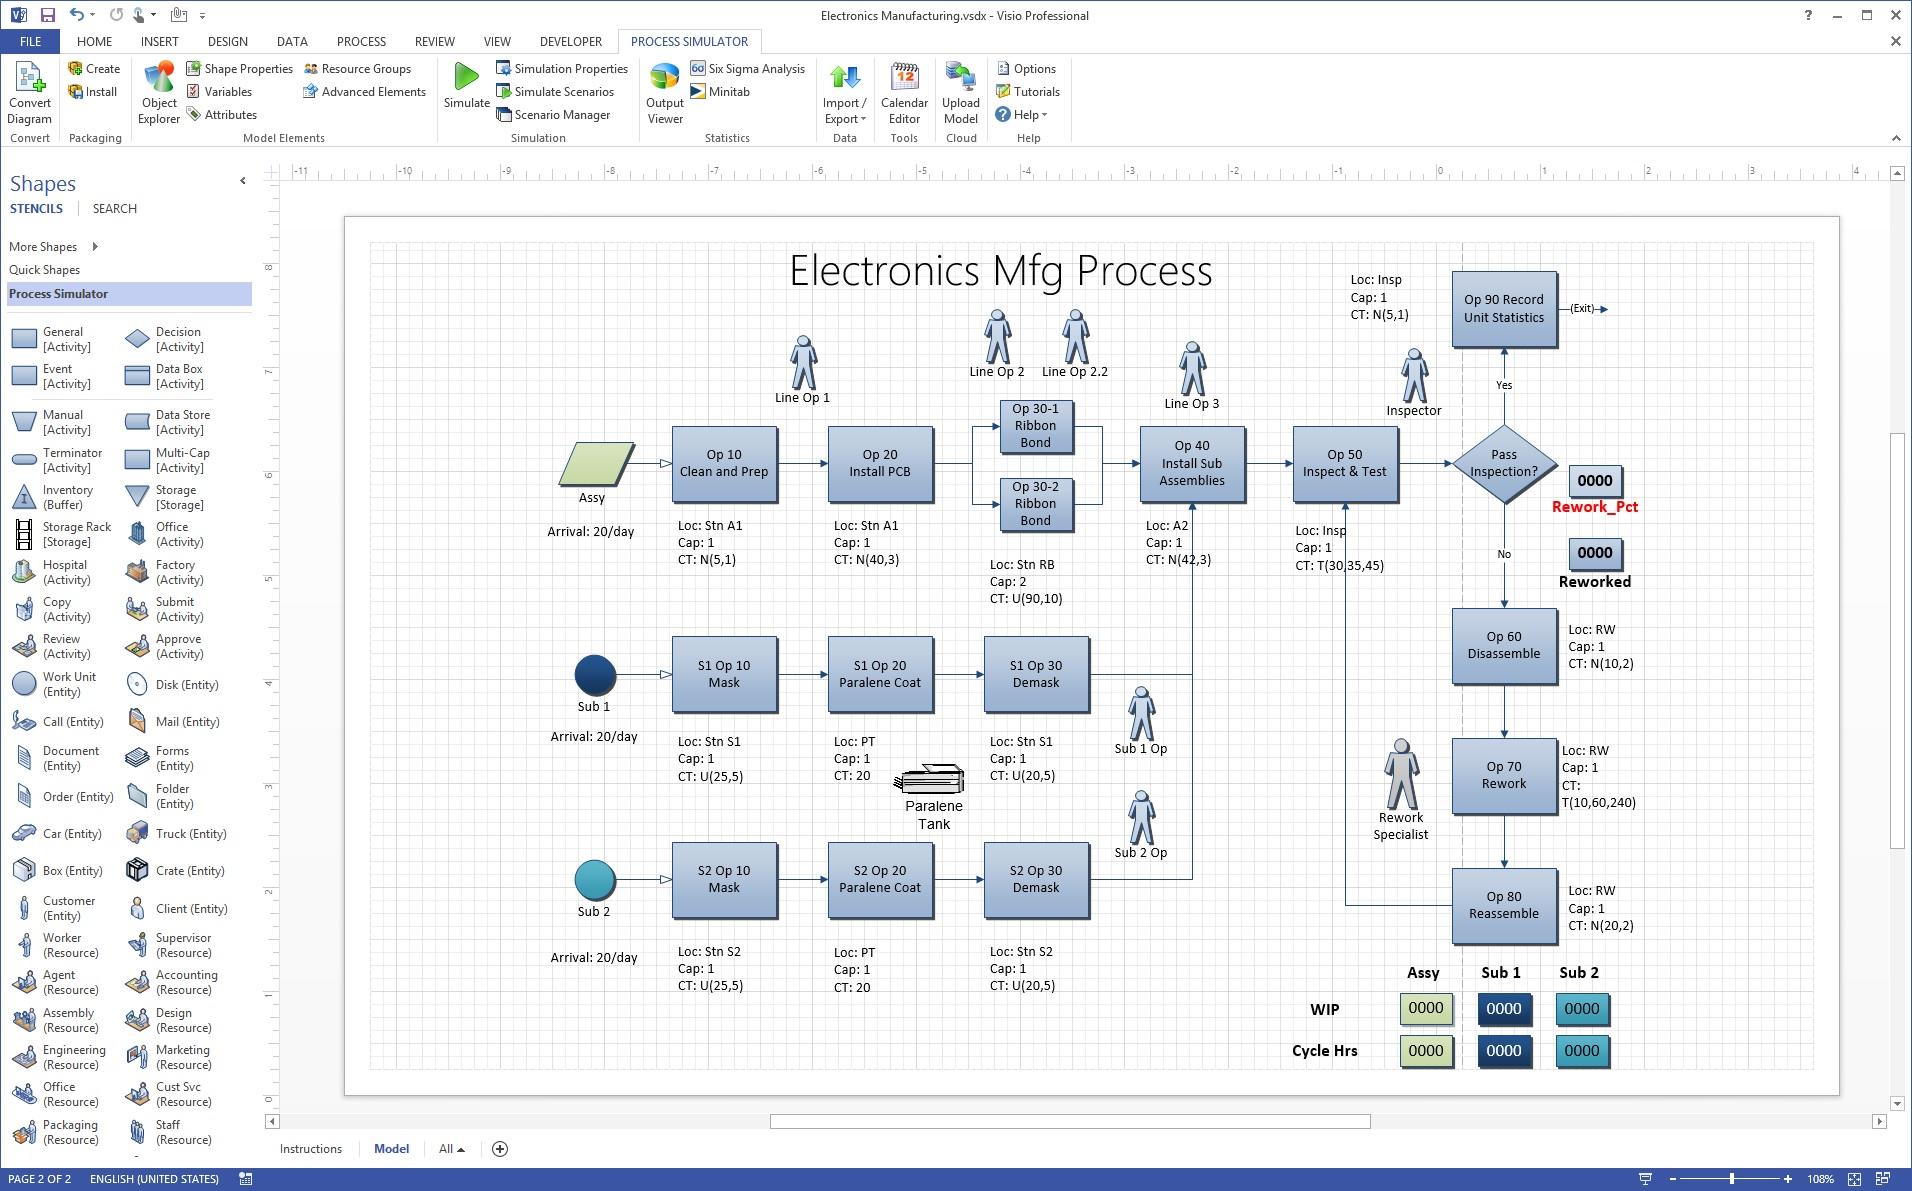
Creating industrial process flowcharts in Visio
Un process flow diagram (PFD) It is a fundamental tool in sectors such as chemical, petrochemical, and manufacturing engineering. It allows the visual representation of the different steps or key components of a plant, helping to:
- Identify unnecessary steps and optimize the process.
- Define quality controls and standards.
- Model processes to better understand them.
- Facilitate agreements between different departments or teams.
The Visio template for industrial flowcharts includes standard and specific shapes to represent equipment, process steps and connections. Here you can:
- Open Visio and select the “Process Flowchart” category.
- Choose a blank or pre-designed template.
- Drag the specific shapes that correspond to each step of your industrial process.
- Visually connect each element, adding text and adjusting arrows according to the actual flow direction.
- Customize details like arrow type and direction, line styles, and colors for clarity.
This method helps not only to capture your ideas but also to Clearly communicate the phases and responsibilities of each area involved in the process.
Complementary Software: EdrawMax and Visio Interoperability
Although Visio is very complete, programs like EdrawMax They have gained ground thanks to their intuitive interface and the ability to import and export Visio-compatible diagrams (VSDX). Their main advantages are:
- Complete libraries of industrial and process symbols, ready to use with drag and drop.
- pre-designed templates that speed up the creation of complex diagrams without prior experience.
- Advanced customization options, such as changing themes, connector styles, and automatic formatting to quickly achieve a professional finish.
- Export in multiple formats (PDF, PNG, JPEG, DOCX, PPTX, XLSX and, of course, VSDX for Visio), facilitating work in multidisciplinary teams.
- Functionality for import files created in Visio and continue editing or improving them in EdrawMax if you need to.
As you have seen, Creating flowcharts and other diagrams in Visio is a valuable skill for any professionalThis tool not only helps you capture internal processes, but also allows you to document, communicate, and optimize work in your company or organization. If you also explore alternatives such as alternatives to Visio o block diagram programs, you'll have a wide range of options to find the option that best suits your way of working. Master diagrams in Visio and transform how you understand and present visual information in your daily work.
Passionate writer about the world of bytes and technology in general. I love sharing my knowledge through writing, and that's what I'll do on this blog, show you all the most interesting things about gadgets, software, hardware, tech trends, and more. My goal is to help you navigate the digital world in a simple and entertaining way.