- The EPROCESS block contains the essential information that the kernel Windows used to manage active processes.
- The !process and .process debugger extensions allow you to list, examine, and change the context of processes at the kernel level.
- Advanced techniques such as DKOM leverage access to EPROCESS to hide processes and evade traditional security tools.

Access to the EPROCESS block within a Windows system is a topic of great interest to cybersecurity professionals , driver developers , and those who study the inner workings of the operating system. EPROCESS is often discussed in the context of advanced debugging, the development of forensic analysis tools, and, of course, when studying offensive techniques such as direct kernel object manipulation (DKOM).
If you've ever wondered how systems protect their processes, or how some rootkits manage to hide processes from the operating system itself, the key lies precisely in understanding and manipulating structures like EPROCESS . With this guide, you'll learn everything from Windows debugger commands and how to interpret process information internally to how these blocks can be used and modified for both legitimate and malicious purposes. All of this is explained in clear language, geared towards advanced and technical users, while still making each step accessible.
What is the EPROCESS block and why is it important?
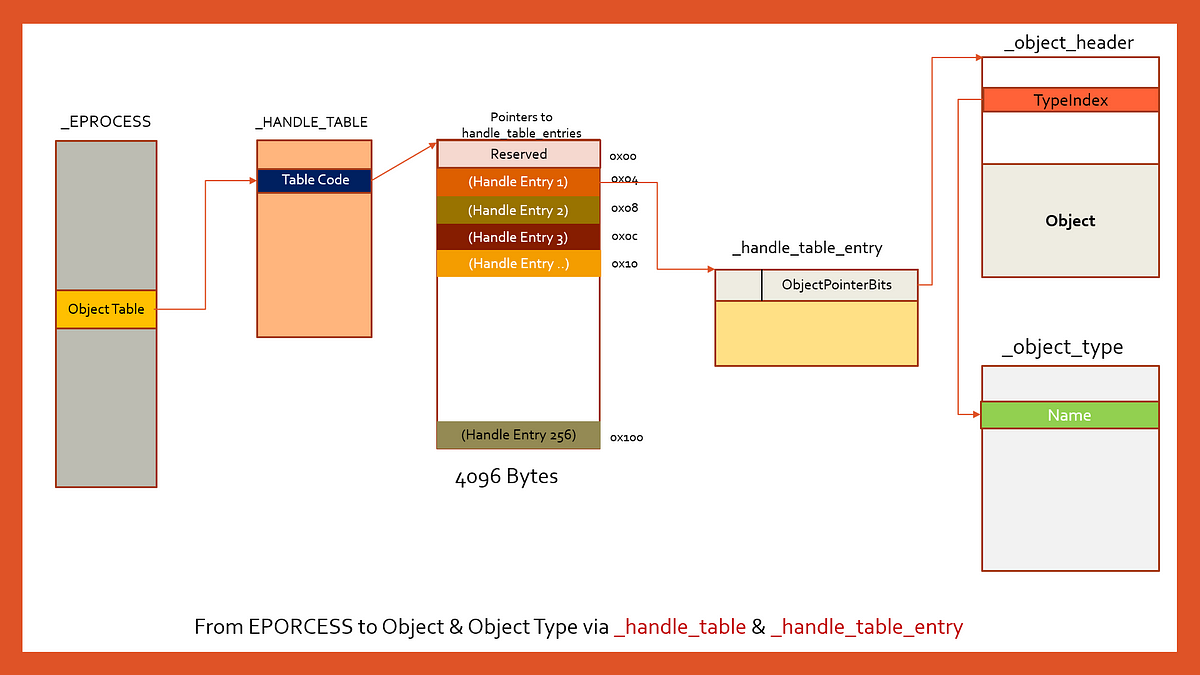
Within the Windows architecture, each running process has an associated block of data in memory called EPROCESS . This block contains all the information relevant to process management: identifiers, priority, address space, thread lists, security tokens, and countless internal details about how that process is running and being managed.
The EPROCESS block resides in kernel memory and is essential for the system's operation. Having access to it means, in practice, being able to monitor and modify the behavior of any process on the system.
Kernel Mode Debugging: The Starting Point
To access and examine the EPROCESS block , you typically need to perform kernel-mode debugging . This method allows for in-depth analysis of low-level processes and memory in a Windows system, as many conventional user tools simply lack the necessary privileges to interact directly with kernel memory.
The Windows debugger comes equipped with very powerful extensions, including !process and .process , which allow you to inspect, filter, and manipulate existing process blocks in the system.
Using the !process command
The !process extension is one of the most commonly used in kernel-mode analysis and development. Its main function is to display detailed information about one or all active processes, including the address of their EPROSS block.
Important! This command can only be executed during Windows kernel-mode debugging sessions. If you try to use it outside of this context, it simply won't work or won't display the expected information.
Basic syntax of the !process command
The usual call has the following format:
!process ]Or, by specifying additional options:
!process 0 Flags ImageNameExplanation of key parameters
- /s Session: Allows you to filter processes by a specific session.
- /m Module: Shows only those processes associated with a specific module.
- : This can be either the hexadecimal address of an EPROCESS block or the PID (process identifier). If omitted, the command displays general information or information about the current context.
- Flags: A value that determines the level of detail of the output (for example, 0 for basic information, 0x7 for verbose level).
- ImageName: Allows you to search for processes whose executable matches the specified name. It is common to specify the name of the binary (for example, notepad.exe) to filter.
If you set Process to zero and omit ImageName , the debugger will display data for all active processes. If you use -1 , it will use the current process being debugged.
Interpreting the output of !process
Example of a typical output:
kd> !process 0 0
 NT ACTIVE PROCESS DUMP
PROCESS 80a02a60 Cid: 0002 Peb: 00000000 ParentCid: 0000 DirBase: 00006e05 ObjectTable: 80a03788 TableSize: 150. Image: System
...
Each entry corresponds to a process, and each process has a "PROCESS" field along with a hexadecimal address. That is the memory address of the EPROCESS block for that process.
- Process direction: First hexadecimal value after “PROCESS” (example, 0x80a02a60).
- Cid: Process identifier (PID).
- Peb: Address of the PEB (Process Environment Block), relevant for user space.
- ParentCid: PID of the parent process.
- DirBase: Page directory base (memory management).
- ObjectTable: Address of the table of objects associated with the process.
- Image: Name of the executable associated with the process.
Details: For complete information, you can run:
!process 7The second parameter (7) indicates that the maximum amount of useful information about the process should be displayed, including threads, resources, and memory usage details.
Beyond the List: Accessing and Changing Process Context
If you want to not only examine but also manipulate the process's memory, you can use the .process command :
.process ] This command allows you to change the debugging context to the process whose EPROCESS block you specify. From that moment on, the debugger will be able to access the process's virtual memory , inspect its loaded modules and command-line parameters, among other actions.
- /i: In live debug only, forces invasive debugging of the process.
- /p: Translates process page table entries for in-depth analysis.
- /r: Recharge Symbols of user after changing processes.
- /P: Translates the page tables of all processes.
The Process argument is the address of the EPROSS block obtained previously with !process.
Practical example to change the context:
kd> .process fe3c0d60
Implicit process is now fe3c0d60
After doing this, you can use commands like !peb to analyze the process structure, its loaded modules, and environment variables.
Understanding Flags and Advanced Analysis Options
The Flags parameter of the !process command allows you to adjust the level of detail in the output. Some common levels are:
- Bit 0 (0x1): Basic priority and timing statistics.
- Bit 1 (0x2): List of threads and events.
- Bit 2 (0x4): Summary view or with stack traces.
- Bit 3 (0x8): Return addresses and stack pointers.
- Bit 4 (0x10): Greater precision in context switches.
Combine these values by adding their bits in hexadecimal ( Flags = 0x7 for a complete analysis).
Practical Applications: Forensics, Security, Development, and Rootkits
Access to the EPROCESS block has multiple applications in both legitimate development and offensive cybersecurity techniques. One of the best-known malware techniques is DKOM.
What is DKOM?
DKOM (Direct Kernel Object Manipulation) is an advanced technique that allows the manipulation of kernel objects such as EPROCESS to alter system behavior. This enables:
- Hide processes, drivers or system elements.
- Increase process or thread privileges.
- Make forensic analysis and malware detection difficult.
By manipulating the Flink and Blink fields of the LIST_ENTRY structure in EPROCESS , a process can be removed from global lists, making it invisible to conventional tools.
Real example: Process hiding technique via driver
Suppose you develop a kernel-mode driver. Using PsLookupProcessByProcessId , you obtain a pointer to EPROCESS from the PID. Then, you locate the offset of the Flink field and modify the structure:
- El Nimble from the hidden process points to the next process in the list.
- El Blink of the next process points to the previous one, skipping the hidden one.
- The hidden process updates its own fields Nimble y Blink to remain silent.
In this way, the process disappears from traditional listings, although it continues to be carried out.
Tools, environments, and requirements for kernel analysis
To perform debugging and manipulation at this level, you need:
- Debugging environment (Windbg, kd) in kernel mode.
- Suitable driver kit (WDK/DDK).
- Appropriate headings and symbols (ntifs.h).
- Supported systems (Windows 2000 and later, with version-specific offsets).
Many examples and PoCs develop hiding drivers and user-mode applications to load and communicate with them using IOCTLs.
Security Tips for Administrators and Analysts
Understanding EPROCESS access and manipulation is key to detecting malicious activity and protecting systems. Examples include:
- Detect rootkits: Tools like gmer, ProcL, and other versions of psinfo can find hidden processes by performing extensive memory scans.
- Strengthen the system: Updating drivers and system prevents driver vulnerabilities and DKOM techniques.
- Limitation of vulnerable drivers: Restrict loading of insecure drivers to prevent kernel tampering.
Ransomware and EDR Solution Bypasses
Some advanced ransomware samples, such as BlackByte, employ similar techniques to evade security solutions. They use vulnerable legitimate drivers to modify kernel routines in real time, delete callbacks, manipulate payloads, and disable EDR monitoring mechanisms, often through dynamically updated kernel version-specific offsets, making them difficult to detect.
Defense recommendations include monitoring for unauthorized drivers, validating the integrity of process lists with independent tools, and restricting drivers on critical systems.
Mastering these techniques, for both legitimate and malicious use, is fundamental for security professionals who want to understand or protect low-level Windows systems. Understanding the EPROCESS block , how to access it, and how to manipulate it is essential for advanced security and malware reverse engineering.


Passionate writer about the world of bytes and technology in general. I love sharing my knowledge through writing, and that's what I'll do on this blog, show you all the most interesting things about gadgets, software, hardware, tech trends, and more. My goal is to help you navigate the digital world in a simple and entertaining way.