- DevTools, flags, and source tests cover different scenarios: local, browser, and controlled production.
- The DevTools Experiments page offers advanced features for debugging and analyzing performance.
- With edge://flags you enable Edge-specific platform capabilities and settings.
- Origin test tokens enable experimental APIs for your users without requiring changes.
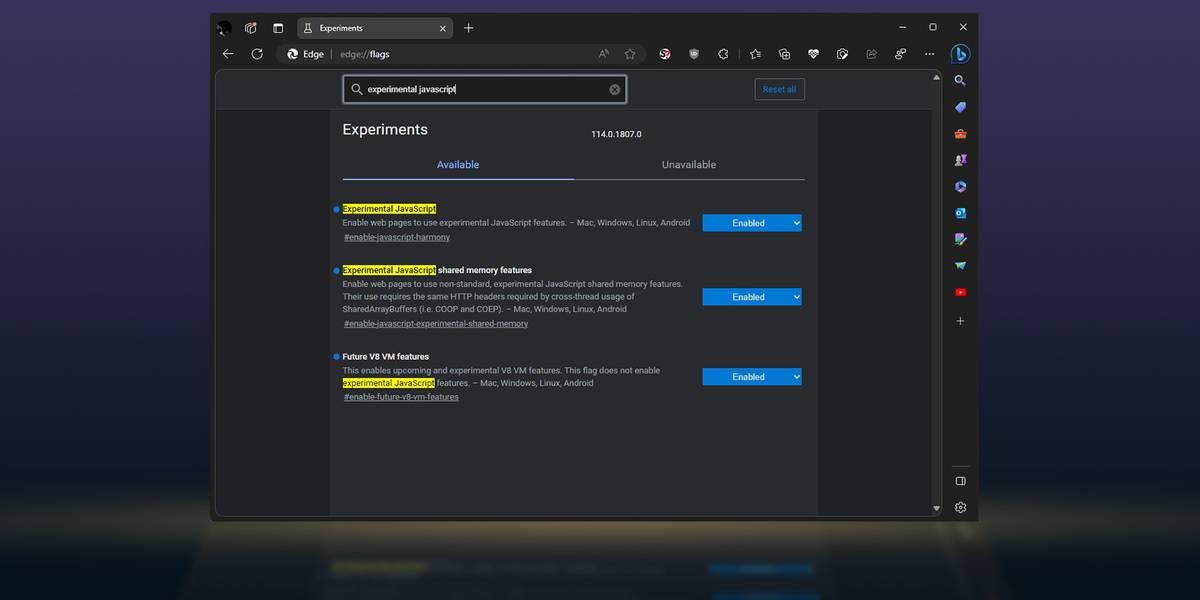
If you work with new web APIs and need to stay ahead of the curve, Microsoft Edge offers several ways to enable features that aren't yet in the stable channel. These include DevTools experiments, browser flags, and source testing . In this guide, we've gathered everything into a single resource so you can safely test, compare approaches, and avoid performance or compatibility issues.
In addition to the familiar edge://flags, Edge integrates an Experiments page into its Developer Tools (DevTools) with checkboxes that unlock features under development. And if you need to test with real users in production, there are origin tests with time -limited tokens . We explain how to enable each option, what risks are involved, and when each is appropriate.
What options do you have to enable experimental features in Edge?
In Edge, you can activate features in three complementary ways, depending on the scenario. First, from the Experiments page in DevTools to change the behavior of the tools themselves . Second, using browser flags at edge://flags to alter the Chromium runtime. And third, with source tests, to enable a specific API for your site's users with a server token or meta tag.
It's important to clearly distinguish between concepts: flags and experiments affect your local browser , while origin tests enable APIs for your website visitors without requiring them to change their settings. This distinction is key to avoiding mixing workflows and choosing the appropriate method for each development phase.
How to enable or disable experiments in DevTools
The DevTools Experiments page provides access to features under development that may change between versions. Enable them only when you need those capabilities for debugging or analysis , and be aware that they may require restarting DevTools.
Quick steps: Open DevTools by right-clicking on the page and selecting Inspect (or use Ctrl+Shift+I on Windows/Linux, Command+Option+I on macOS). In the DevTools toolbar, go to Settings and choose the Experiments page. Check or uncheck the boxes as needed and click Reload DevTools to apply the changes.
Reset Experiments to Default Values
If you experience instability or slowness, you can revert to the initial state. Open DevTools, go to Settings, and on the Preferences page, click the Restore Defaults and Refresh button. When you close DevTools, it will revert to the default experiment settings.
Filter and locate experiments in DevTools
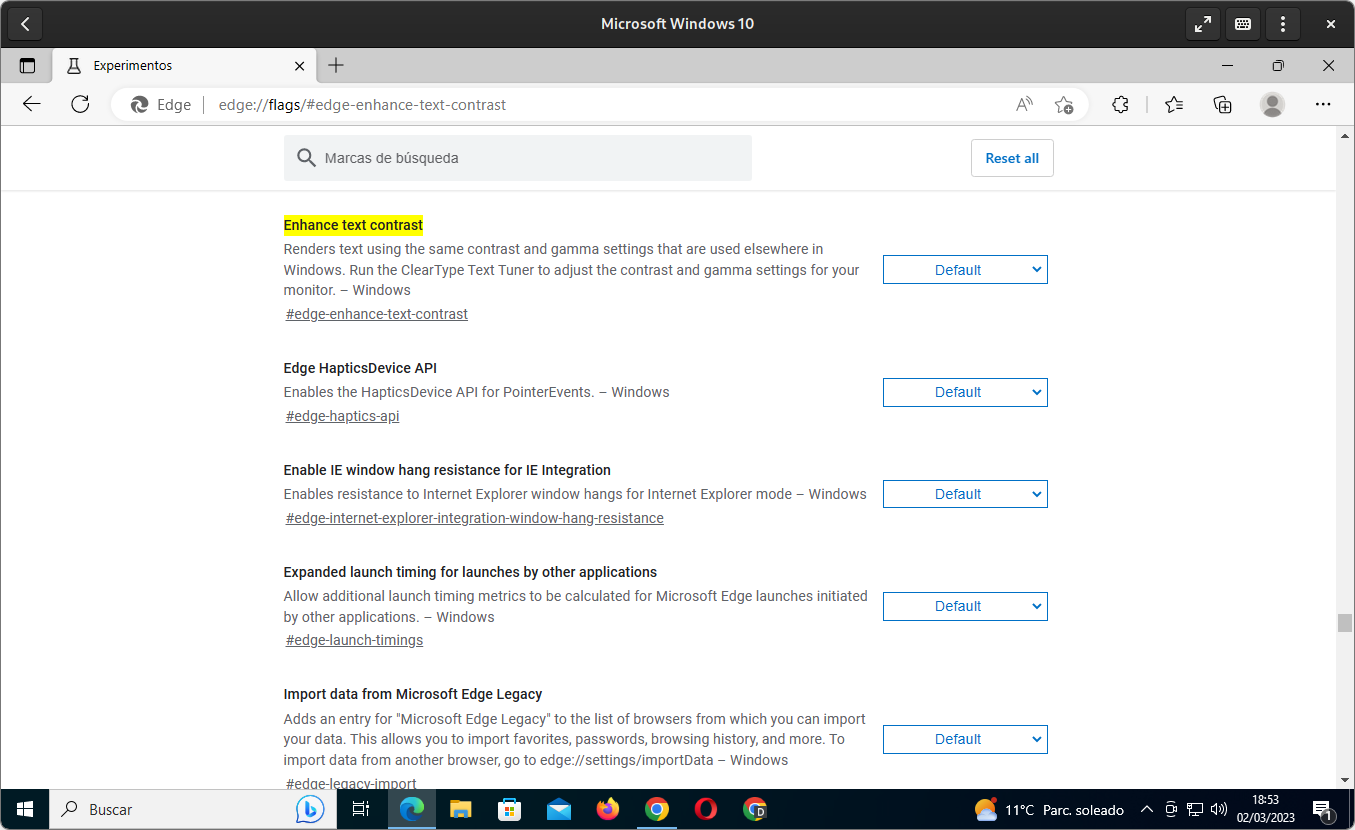
To find a specific checkbox, use the Filter text box on the Experiments page . As you type, you'll only see the options that match your text. Clear the filter to get the full list back.
How to send feedback to the Edge DevTools team
Microsoft is requesting specific feedback on these features. If you encounter any issues or have suggestions, please contact the Edge DevTools team through the official channels . The more detailed your report, the more helpful it will be in stabilizing the feature.
List of current experiments in DevTools
The following list summarizes the available checkboxes in the latest Canary channel and their stable counterparts. As a general rule, they are present in Edge Canary 140 and Edge Stable 138 , unless otherwise noted.
Capture of node creation stacks
It allows you to collect JavaScript stack traces when nodes are added to the DOM at runtime. It adds the Stack Trace tab to Elements, next to Styles, to inspect the origin of an insertion.
Protocol monitor
Activate the Protocol Monitor tool to view CDP messages sent and received by DevTools . It can be accessed from More Tools or from the Command menu by searching for "protocol".
Option to expose internal elements in heap snapshots
Displays a checkbox in the Memory tool to expose internal elements in heap snapshots and facilitate advanced diagnostics.
Vertical drawer configuration
Marked as new since Edge 139. Currently has no practical effect ; to move Quick View, use its own dock button on the right. It does not appear in Stable 138.
APCA perceptual contrast in the color picker
It replaces the old AA/AAA ratios with the APCA algorithm , which calculates contrast based on context, font thickness and size, and environmental conditions.
Full accessibility tree view in Elements
Add a button to toggle between the DOM tree and the accessibility tree within the Elements tool, switching the view according to your needs.
New visual font editor in Styles
Introduce the Font Editor to change units, toggle keywords, convert, and generate exact CSS for typographic properties without leaving the Styles tab.
Automatic contrast reports in the Problems panel
Enables automatic detection and reporting of contrast problems accessible from the Problems tool, with relevant documentation and resources.
Characteristics of experimental cookies
It allows testing experimental features related to cookies , useful for validating platform changes before they are sent.
Highlight offending node or attribute in the DOM
Highlight problematic nodes or attributes in the DOM tree to speed up the discovery of markup or rule errors.
Group origins into created and deployed trees
In Origins, separate resources into authoring (created) and production (deployed) folders to differentiate original code from packaged code.
Hide code from the Skip list in Sources view
It allows you to hide the code marked to be omitted in the Sources tree , making navigation between relevant files easier.
Performance: postMessage streams
In the Main track, it distinguishes Schedule postMessage and On message events , linked with initiator arrows to analyze queues and controllers between threads.
Performance: Experimental Insights Panel
Add more information to the Insights sidebar . First, enable Insights, and then its experimental version to see even more data.
Console: Log uncaught DevTools exceptions
Controls whether internal DevTools exceptions are logged in the Console , useful for debugging the tools environment itself.
Enable webhint in Problems
Integrate webhint to display accessibility, compatibility, security, performance, and PWA suggestions in the Issues panel, with links to related tools.
Show problems in Elements
Paints wavy underlines in the DOM for detected syntax errors , with direct access to the explanation of the problem.
Open source files in Visual Studio Code
Replace the Origins code editor with VS Code for local files. When you select a working folder, the links open the file directly in VS Code , and changes are synced live.
Adaptive CPU Throttling
Activates a dynamic CPU throttling strategy for performance testing under different conditions.
CSS Copilot integrated into the sidebar
Allows you to ask Copilot about HTML elements and CSS rules from Elements . Requires the Edge sidebar to be active.
Dynamic Heap Profile
Live-update heap profile to see memory trends as you interact with the page.
Heap sampler timescale
Performance displays a timeline of the sampling heap profile generator to study allocations and retentions over time.
Performance: Invalidation tracking
Add an Invalidations section to the Recalculate Style summary to learn which nodes caused costly recalculations.
Performance: Show all events
Toggles the display of all events recorded in the trace session, useful for thorough investigations.
Performance: V8 runtime call statistics
The Performance tool displays internal V8 engine call metrics , providing time context in JS.
Performance: Improved trace collection v2
It makes Performance capture new types of traces for the improved v2 format being rolled out in Chromium.
Performance: Collecting source text in compiled scripts
When exporting the trace file, include the source text of the scripts compiled within the trace for offline analysis.
Performance: Trace Event Debug Mode
Add a Tracking Event section to the Summary with the name, duration, and debugging information for the selected event.
Instrumentation breakpoints
It improves reliability by stopping at instrumentation breakpoints , facilitating inspections at critical points in the pipeline.
Using scope information from source maps
It allows DevTools to use the scope context of source maps to provide debugging that is more faithful to the original code.
Origin Testing: Enable experimental APIs on your site
When you want to test with real users without asking them to make changes, use source testing. A token temporarily enables an experimental API for your domain in Microsoft Edge , even if the feature is disabled by default in the browser.
How it works: Edge detects the origin test token in your HTML or HTTP header and internally activates the flag for that origin. The user doesn't need to touch edge://flags or install anything.
Registration and obtaining the token
Steps: Go to the Microsoft Edge Source Testing page, choose an active test, and accept the terms . If prompted, sign in (for example, with GitHub) and complete the form, specifying your domain or subdomain.
You can register: a single domain, a specific subdomain, or the domain plus all its subdomains . Paths and parameters are not supported; registration is limited to the root. Upon submission, your token is generated and becomes visible in the Registrations section.
How to use the token in production
Insert the token as meta tag in the head or as a response header. Examples: <meta http-equiv='origin-trial' content='EXAMPLE_TOKEN'> the header Origin-Trial: EXAMPLE_TOKEN. To stop participating, remove the meta or header.
Detect features and prepare reservations
Treat tests as experimental. Use feature detection and add fallbacks when the API is unavailable , if the token expires, or if the team decides to end the experiment early. See the MDN feature detection guide.
Testing on localhost and expiration
The token mechanism does not work on localhost . To develop locally, enable the appropriate flag at edge://flags. Tokens typically expire after 6 weeks ; renew them from the Origin Testing page when necessary.
Duration and early end
A trial can last until its scheduled end date or be closed early for security or design reasons . If it ends early, the organizers will contact the registered developers by email.
Send feedback about your experience
From the testing page, access the Comments button to open the Issues tab of the repository and document your use case and results. This input is vital for standardization.
Browser Flags: Enable platform features in Edge
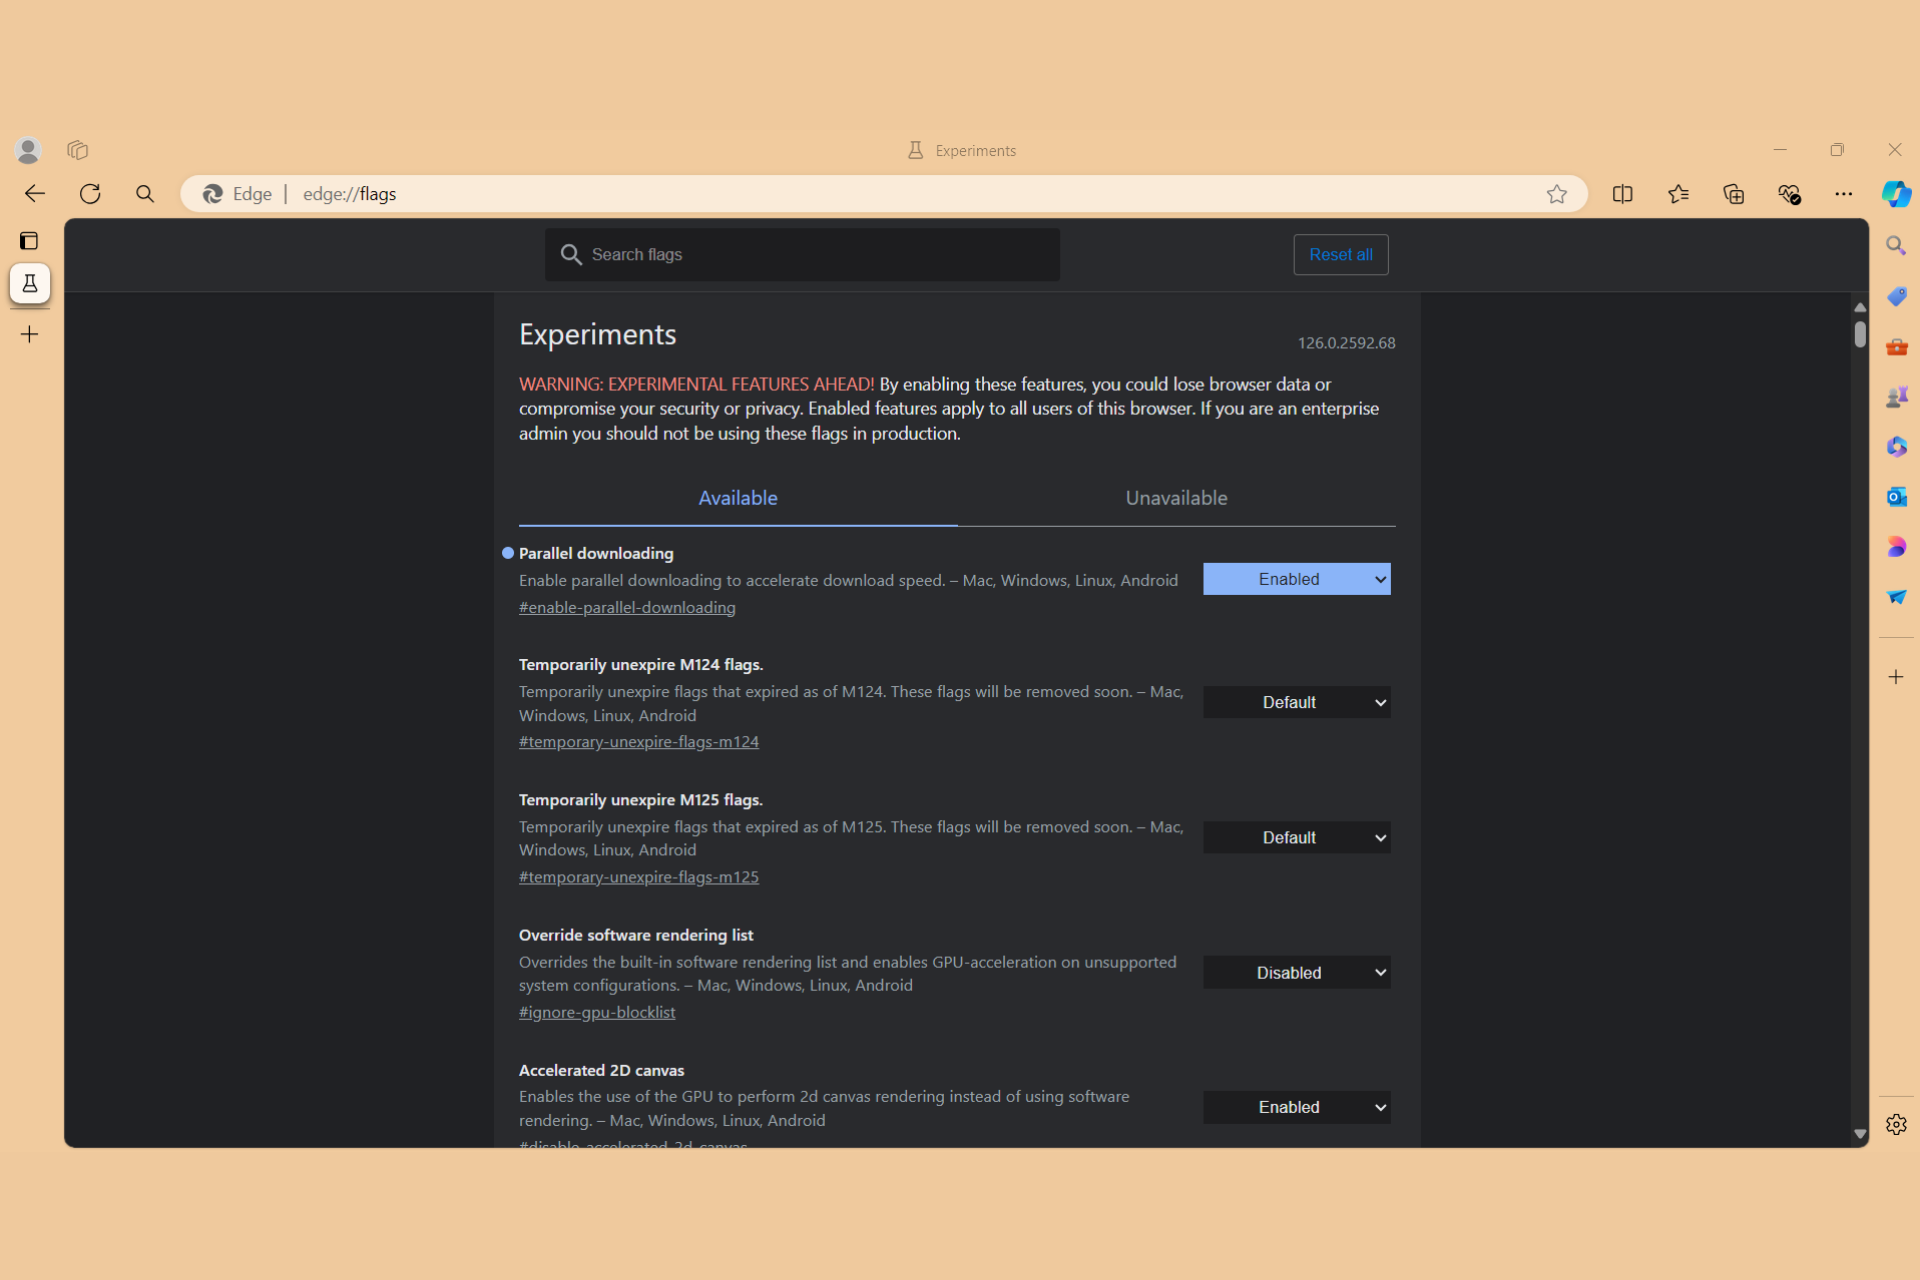
Flags are hidden switches in Chromium-based browsers. In Edge, navigate to edge://flags to enable features under development , such as web platform APIs or browser behavior changes.
Warning: These options are experimental. Changing them in your everyday browser is not recommended ; do so in development channels (Beta, Dev, or Canary) and only when advised by a reliable guide.
about://, chrome:// and edge://: the trick for any Chromium
All Chromium browsers resolve internal schemes. If you type chrome://flags in Edge, it will override to edge://flags . For inclusive documentation, use about://flags: each browser overrides it to its correct scheme.
Useful flags and practical examples in Edge
Some Edge-specific flags are very useful. Below are examples that you can enable from edge://flags , illustrating how to work with this section.
Improve text contrast
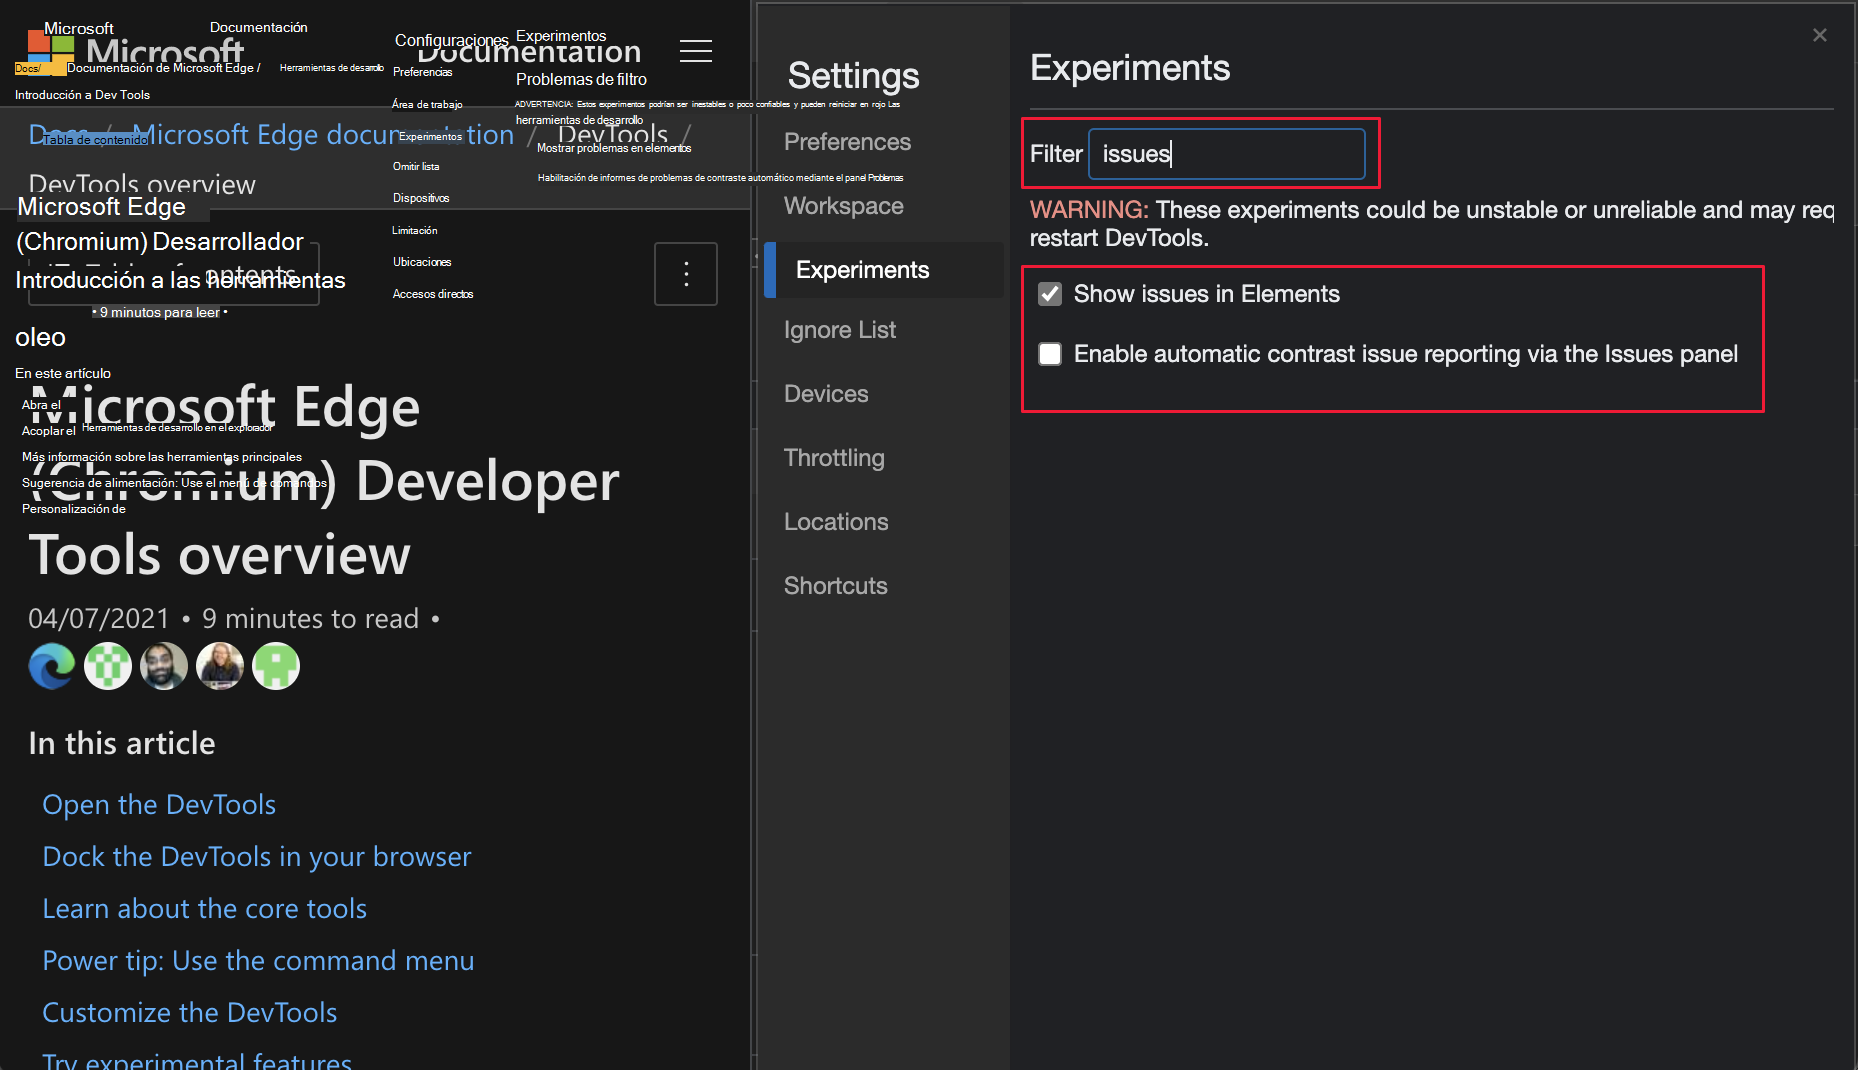
En Windows, active edge://flags/#edge-enhance-text-contrast all with Use system contrast and gamma when rendering fonts, achieving a more homogeneous reading.
Block multimedia autoplay
With edge://flags/#edge-autoplay-user-setting-block-option you enable the option to block autoplay. Then, go to Settings > Cookies & site permissions > Autoplay or go to edge://settings/content/mediaAutoplay.
Navigate back with the Backspace key
the flag edge://flags/#edge-backspace-key-navigate-page-back allow go back with Backspace and forward with Shift+Backspace. It's very useful if you primarily browse with a keyboard.
Tabs with rounded corners
If you prefer a softer look, edge://flags/#edge-visual-rejuv-rounded-tabs round the four corners of the eyelashes and visually separates them from the omnibox.
Smooth PDF Scrolling
Enable edge://flags/#edge-smooth-scrolling-enabled-pdf all with smoother scrolling when viewing documents PDF integrated into the browser.
Send content to Chromecast
If the Broadcast option doesn't work, enable these three flags: #load-media-router-component-extension, #global-media-controls-for-cast y #mirroring-serviceAfter a restart, you should be able to send tabs, desktop, or files.
Sleeping tabs to save resources
In Edge's developer channels, you can enable Sleeping Tabs to hibernate inactive tabs and reduce RAM usage . Search for the option by name, enable it, and adjust the timeout in Settings > System > Save resources. You can also maintain a whitelist of sites that shouldn't be put to sleep.
Good practices when experimenting
Before you touch anything, prepare your environment. Use Edge Canary or Dev for testing, keep the stable version for daily work , and document what you've enabled and why. If something goes wrong, you'll know what to revert.
When using source testing, implement feature discovery and alternate paths . APIs can change, expire, or be discontinued; your product shouldn't break if they disappear.
Don't ask your users to change browser flags. Flags are intended for development, not production environments . If you need user testing, use source test tokens and segment the deployment.
Finally, remember that experimental features can be unstable or unreliable . If performance degrades, disable non-essential features and restore default values in DevTools when necessary.
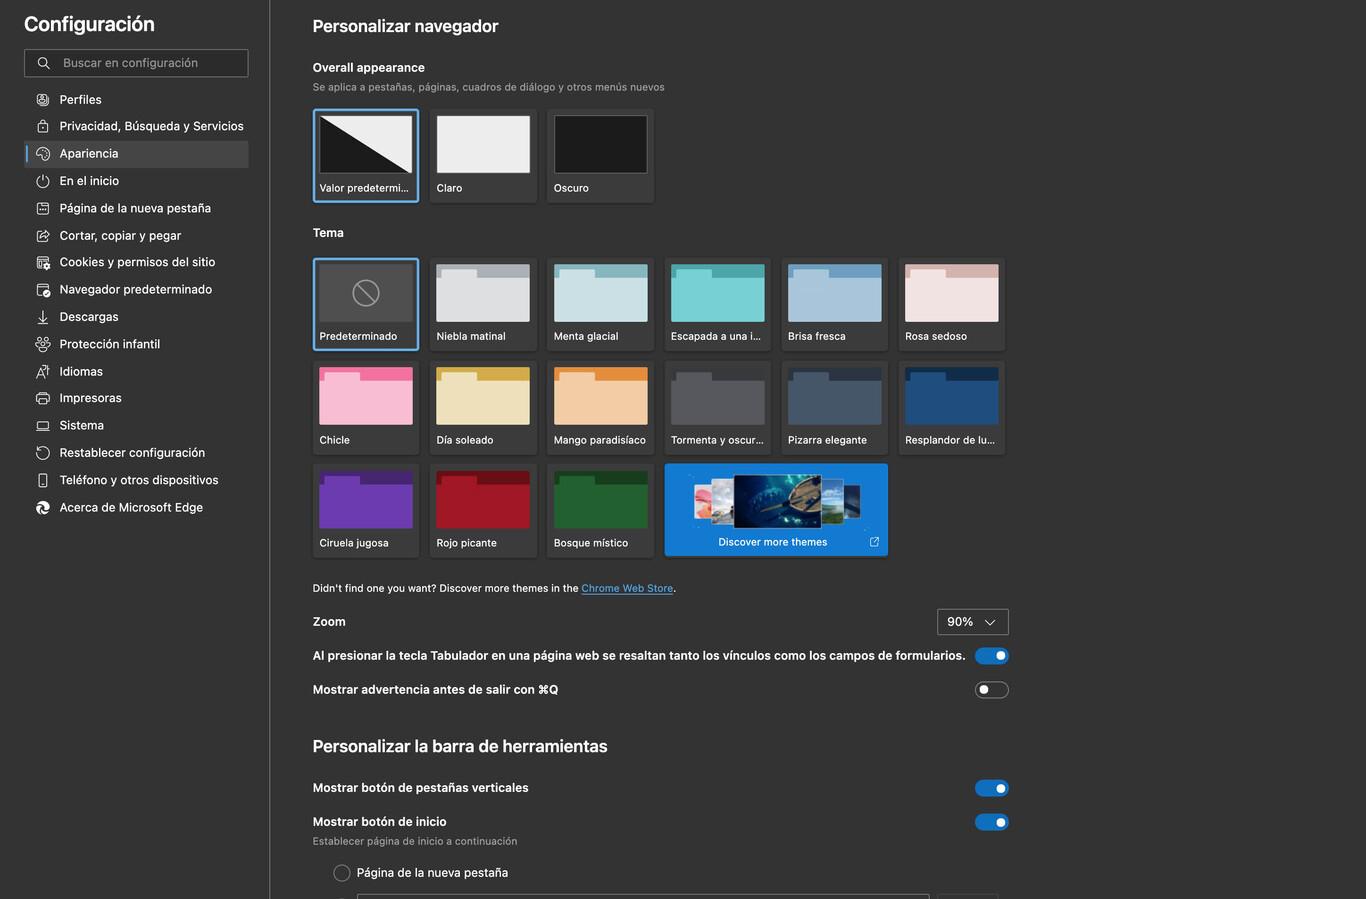
Exploring Edge's experimental capabilities lets you validate new APIs, improve your debugging workflow, and prepare for more robust releases. Between DevTools Experiments, the flags at edge://flags, and source testing, you have a comprehensive range of tools for every stage of development: from local research to controlled testing with real users, always with clear warnings, rollback methods, and guidelines for providing valuable feedback to the Microsoft team and the Chromium community.

Passionate writer about the world of bytes and technology in general. I love sharing my knowledge through writing, and that's what I'll do on this blog, show you all the most interesting things about gadgets, software, hardware, tech trends, and more. My goal is to help you navigate the digital world in a simple and entertaining way.